

Transforming unstructured data to a graph with BAML and Kuzu

AI Engineer at Kùzu Inc.
One of the primary use cases for a property graph database like Kuzu is to explicitly model relationships between entities in your data. However, as anyone who has worked with real-world data can attest, the vast majority of data out there is not naturally clean or structured, and may be stored in a variety of unstructured formats like text files, PDF files, images and more. Historically, this has created a barrier to graph database adoption due to the challenge of reliably extracting entities (nodes) and the relationships (edges) between them from the unstructured data.
It’s amply clear these days that LLMs are proving to be powerful and versatile at a large variety of tasks. In this post, we will show how to use Kuzu in combination with BAML, a domain-specific language for generating clean, structured outputs from LLMs, to help transform the unstructured data into a graph that can be used for downstream analysis and RAG. Using tools like BAML can help increase trust in your LLMs’ outputs by adding some much-needed engineering rigour downstream of the generation process. We’ll also look at some evaluation results to validate the quality and robustness of several LLMs’ outputs. The key steps in the overall workflow are summarized in the diagram below:
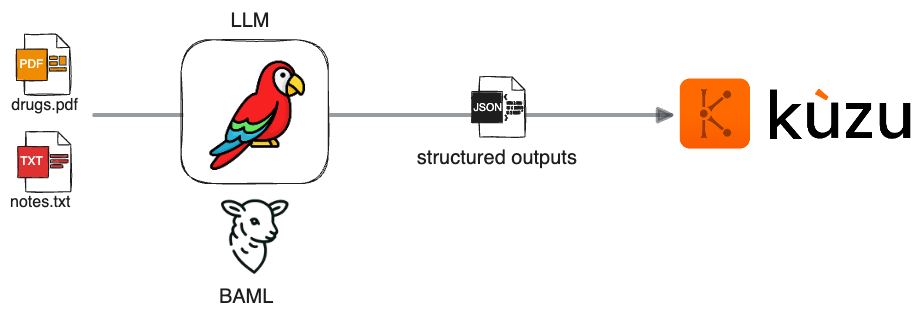
We start with unstructured data upstream (it could be text, images, PDFs, etc.). BAML is used to prompt the LLM to generate a structured output in JSON format, which can then be persisted as a graph in a Kuzu database. Let’s understand this in more detail through a concrete example.
Problem statement
Consider this scenario: You are a developer working at a healthcare firm that has custom, proprietary data on drugs, including their generic names, brand names, side effects and the conditions they are used to treat. Additionally, you have a dataset of clinical notes taken by physicians that mention the side effects experienced by patients taking these drugs.
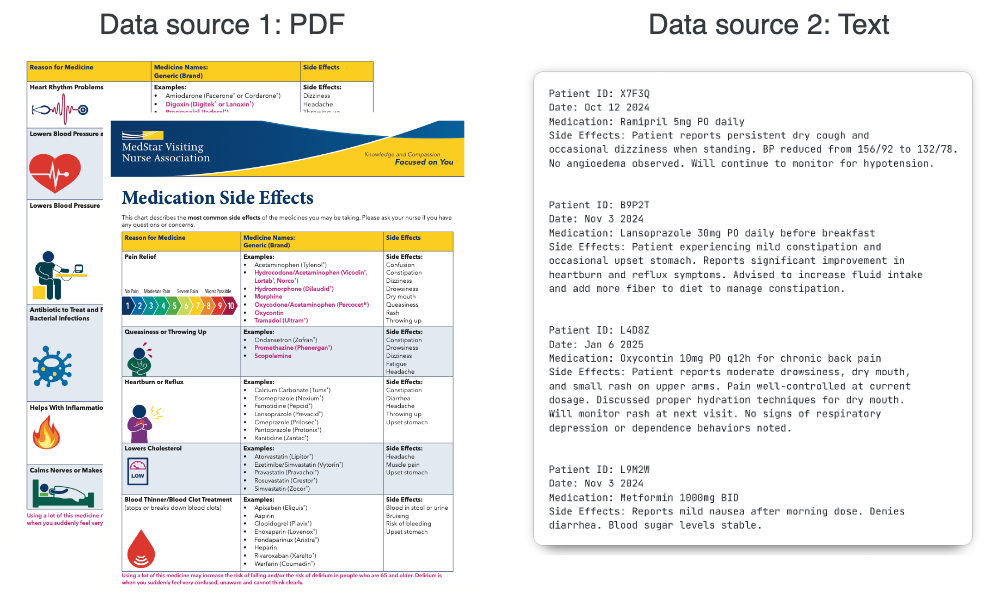
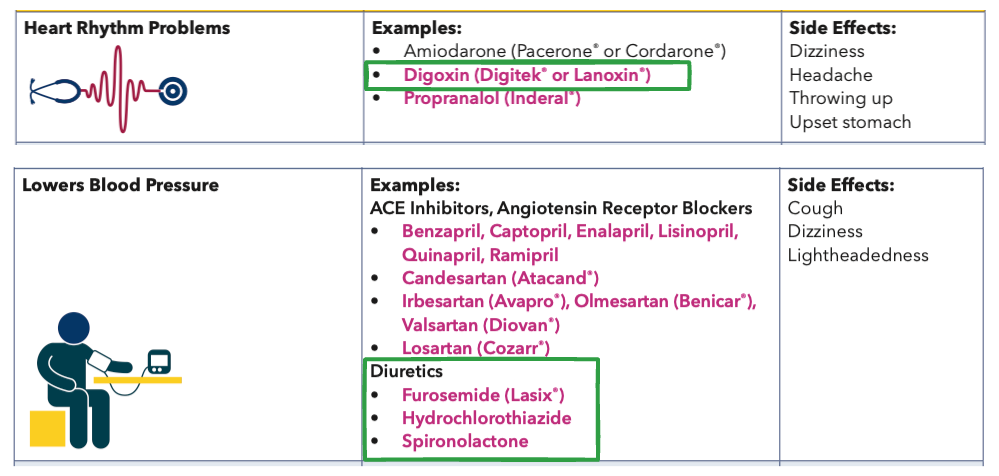
The two datasets are stored in two entirely different formats: The data on drugs is stored in a PDF file1 that contains tables with nested information, and the clinical notes are stored in plain text, output from a custom EMR system. Let’s take a closer look at the table inside the PDF file. There’s some degree of structure to the data, but it’s far from clean and consistent, and the presence of nested structures (comma-separated items, bullet points, etc.) in each make it non-trivial to extract clean data programmatically.
Our task: Bring these two otherwise separate datasets together to construct a knowledge graph that can be queried downstream to answer questions about patients, drugs and their side effects.
Methodology
We could go about transforming the PDF data into a structured form in a number of ways. The most obvious approach would be to use a PDF parsing library like PyMuPDF or pdfplumber to extract the data as text, and then prompt an LLM to extract entities and relationships from the text. However, this approach requires a lot of custom code to handle the idiosyncrasies of the nested data shown above, and even then, the output isn’t guaranteed to be clean and consistent enough for an LLM to reason over.
A simpler and quicker way is to use a multimodal LLM like OpenAI’s gpt-4o, or its smaller cousin gpt-4o-mini
that take in images as input. We can use BAML to prompt these models to extract the
relevant entities and relationships from an image of each page of the PDF, rather than writing a ton
of custom code to preprocess the data as text.
This approach of extracting entities and relationships from images is surprisingly effective, in terms
of cost, quality and speed, as we’ll see below!
Here’s a visual breakdown of the methodology:
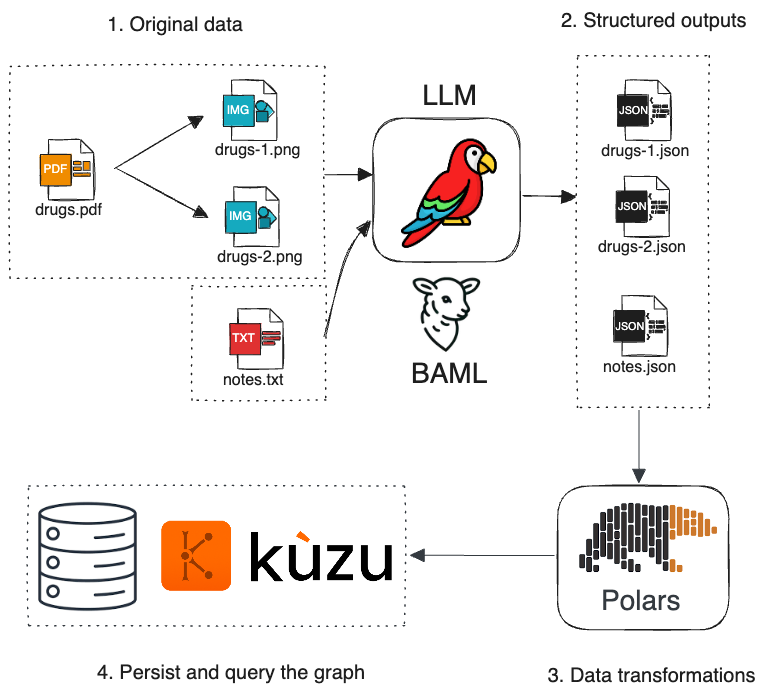
Let’s walk through the key steps in the following sections.
1. PDF -> Image
This simple FastAPI app is used to transform the PDF data of drugs into a series of PNG images2.
The images are transformed to their base64-encoded string representations, which multimodal LLMs like gpt-4o-mini can interpret
well. Because each page of the PDF is represented as a separate image, we can easily scale up this approach to handle
PDFs with far more pages than what’s shown in this example, concurrently processing each page to speed things up.
The text data (clinical notes) is left as is, because it’s already in a clean text format that can read by an LLM.
2. Extract structured data using BAML
We are now ready to prompt the LLM to extract entities and relationships from the image and text files. In this section, we’ll break down the BAML prompts that are used for each task: information extraction from images and text.
Graph schema
The preliminary step, prior to any LLM prompting, is to sketch out a graph schema that we will use to model our domain. This is what informs our BAML schema design, shown further below.
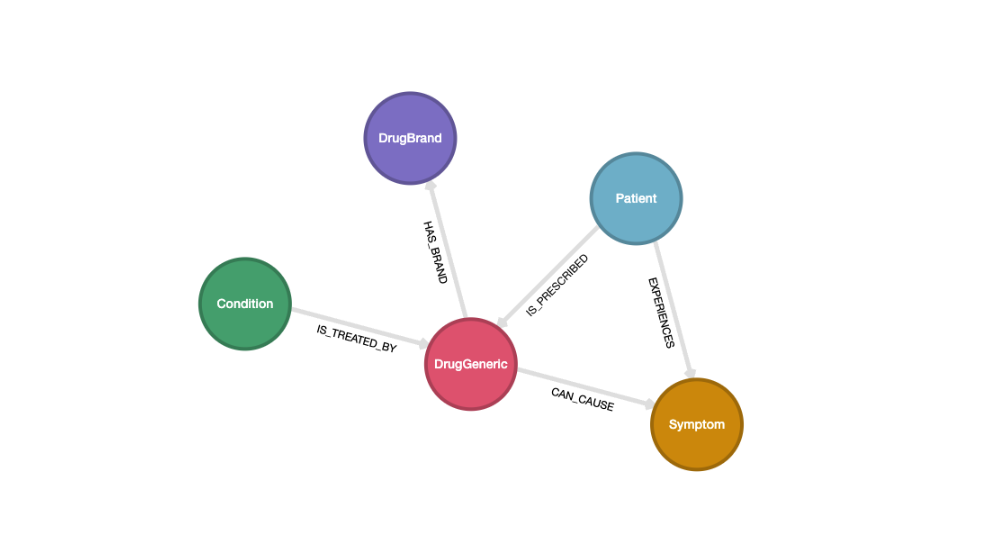
In the PDF data, each drug has a generic name and (optionally) a brand name. Each class of
drugs has a set of side effects, and are used to treat a particular condition. This is all captured in the graph
schema shown above. We model two kinds of drug nodes: DrugGeneric and DrugBrand. Each side effect is
modelled as a Symptom node, and a particular Condition is treated by a DrugGeneric node.
Additionally, the text of clinical notes consists of patients who experience side effects while taking a drug.
This is captured through the Patient node and the EXPERIENCES relationship to the Symptom node.
Our schema design effectively combines these two separate datasets into a single graph in Kuzu!
Extract from images
BAML is a domain-specific language (DSL) that ensures type safety of an LLM’s output, providing quality structured outputs that respect the desired schema. The BAML schema (or data model) is defined in a way that aligns with the expectations of our Kuzu graph schema that’s shown above.
class Drug {
    generic_name string
    brand_names string[]  @description("Strip the ® character at the end of the brand names")
}

class ConditionAndDrug {
    condition string
    drug Drug[]
    side_effects string[]
}
In BAML, a class is basically a data model that specifies the overall structure of the data (and its field types) that we want to extract.
In this case, we want to extract a ConditionAndDrug object, which contains a condition string, an array of Drug objects,
and an array of side_effects strings. The @description annotation is used to provide a hint to the LLM about how to
populate the data for the brand_names field.
Prompts in BAML are specified as functions. Here’s the prompt for extracting the condition, drug names and side effects from the image of the PDF table:
function ExtractFromImage(img: image) -> ConditionAndDrug[] {
  client OpenRouterGpt4oMini
  prompt #"
    You are an expert at extracting healthcare and pharmaceutical information.

    Extract the condition, drug names and side effects from the provided table with these columns:
    - Reason for drug
    - Drug names: Generic name & (Brand name)
    - Side effects

    {{ ctx.output_format }}

    {{ _.role("user") }}
    {{ img }}
  "#
}
Every prompt consists of an LLM client (we use an OpenRouter openai/gpt-4o-mini alias here), and a prompt template
that specifies the system and user prompts via a Jinja template. The ctx.output_format is a special variable
that transforms the BAML classes (data models) into a JSON-like representation with hints injected at appropriate
locations, to guide the LLM towards generating a valid output. Here’s what the actual prompt looks like once it’s
formatted by BAML:
You are an expert at extracting healthcare and pharmaceutical information.

Extract the condition, drug names and side effects from the provided table with these columns:
- Reason for drug
- Drug names: Generic name & (Brand name)
- Side effects

Answer with a JSON Array using this schema:
[
  {
    condition: string,
    drug: [
      {
        generic_name: string,
        // Strip the ® character at the end of the brand names
        brand_names: string[],
      }
    ],
    side_effects: string[],
  }
]
Note the comment line beginning with // just before the brand_names field — this is used to nudge
the LLM towards understanding that it needs to transform its output to strip the ® character at the end of the brand names,
which is useless for our graph downstream. Normally, you would handle special characters like this
during the postprocessing stage by writing custom code (say in Pydantic), but BAML allows you to push
some of this logic into the prompt itself. Because BAML ensures types safety in the output, our level
of confidence in the LLM’s ability is higher.
To reiterate: in BAML, functions are prompts, and classes are models (schemas). You then write tests that can be executed interactively or from the terminal to validate the structured output from the LLM. All of this is done in the comfort of the IDE, before you even write a line of application code!
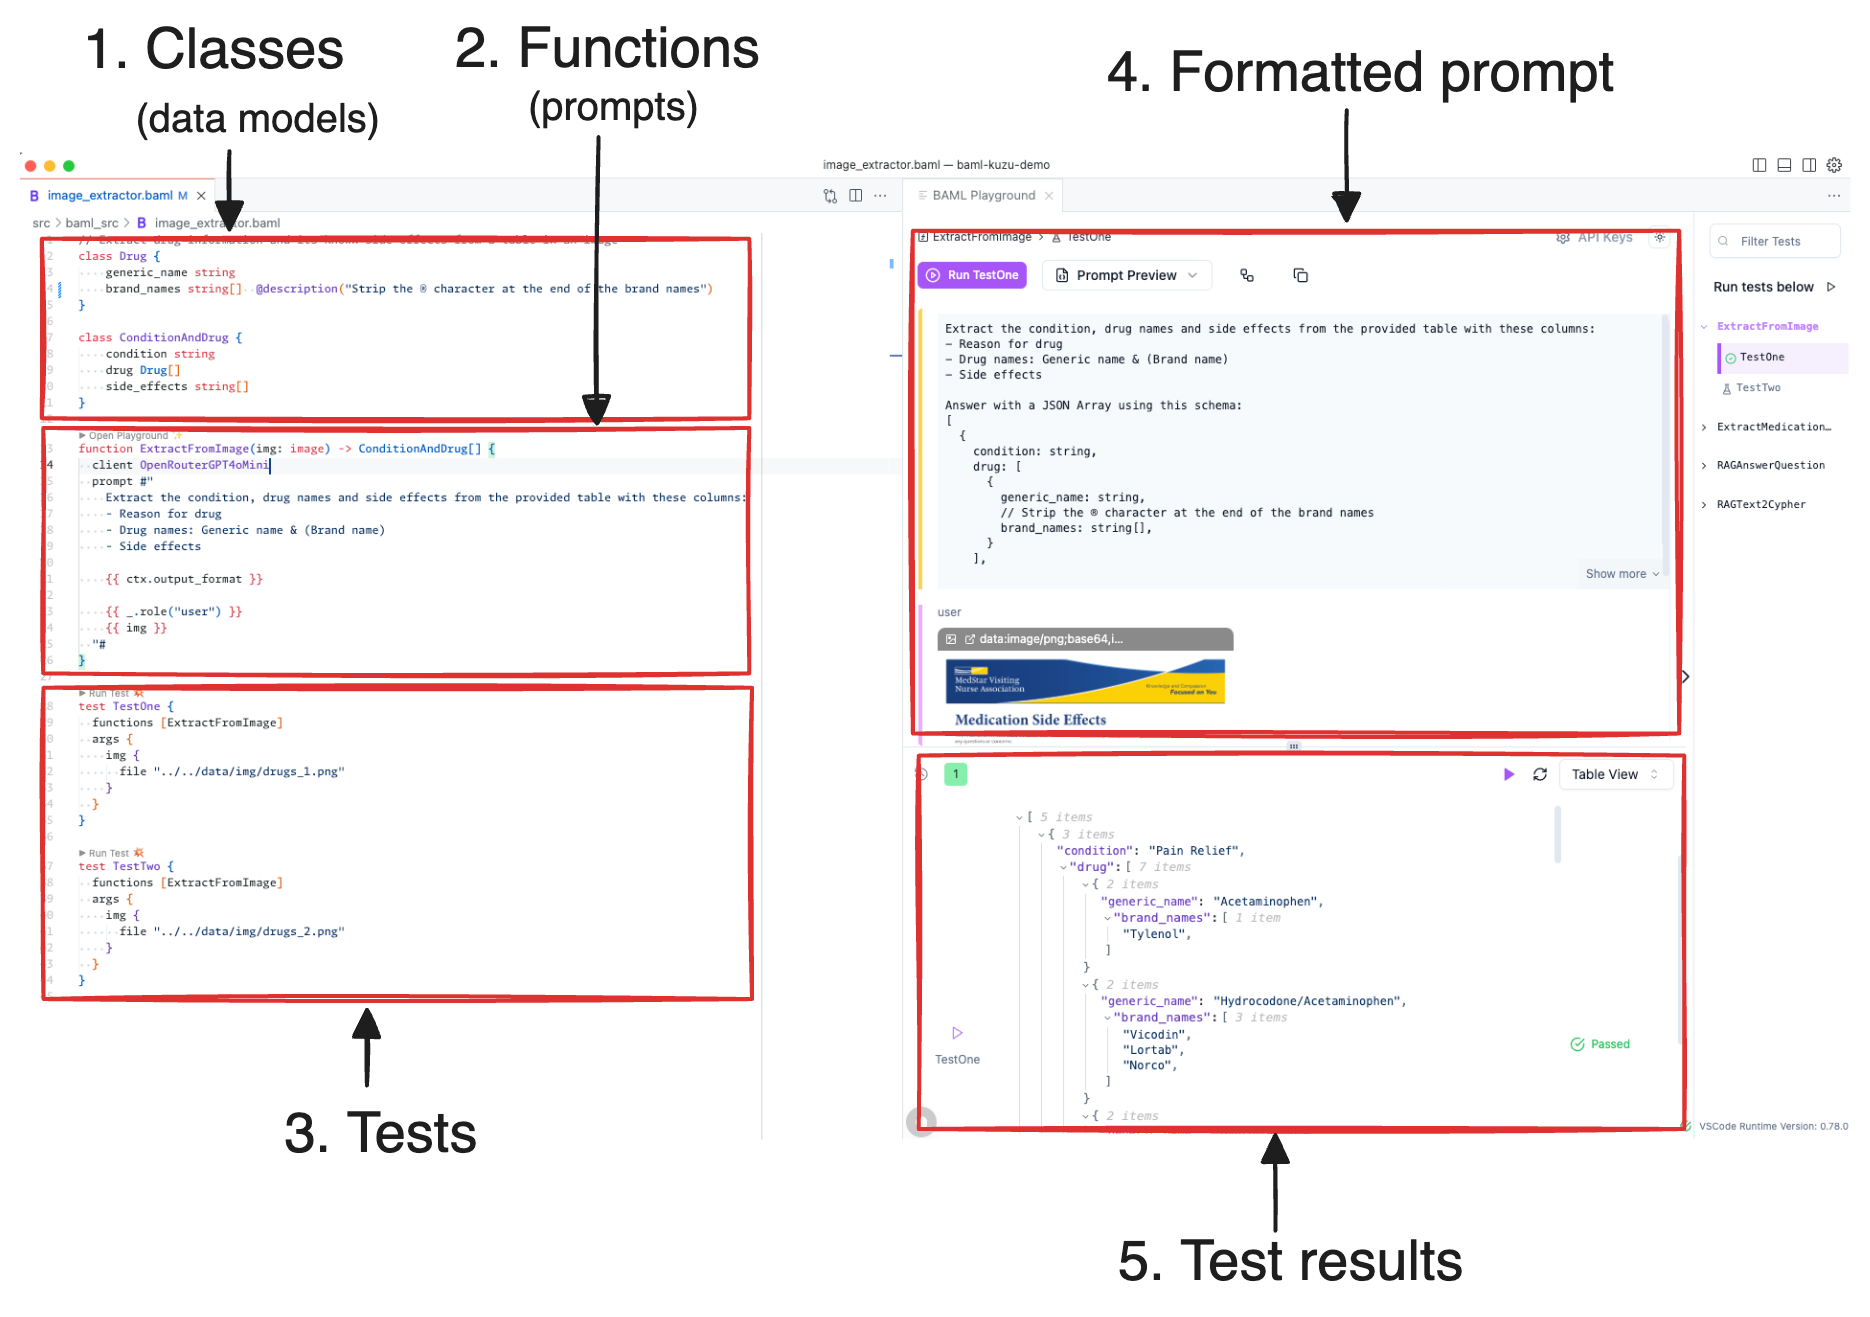
Below is a sample structured output from the BAML prompt (it’s in JSON format). As can be seen, the LLM correctly captures both the structure and the content of the input image, including the nested fields. BAML’s parser ensures that the LLM’s output is valid, parseable JSON so the downstream tools (Polars and Kuzu) can use it without any parsing errors.
[
  {
    "condition": "Pain Relief",
    "drug": [
      {
        "generic_name": "Acetaminophen",
        "brand_names": ["Tylenol"]
      },
      {
        "generic_name": "Morphine",
        "brand_names": []
      }
    ],
    "side_effects": [
      "Confusion",
      "Constipation",
      "Dizziness",
      "Drowsiness",
      "Dry mouth",
      "Queasiness",
      "Rash",
      "Throwing up"
    ]
  }
]
Extract from text
The second task is to extract entities and relationships from the text data of clinical notes. We can write a BAML model and prompt to extract side effects experienced by a patient, as well as useful metadata like a drug’s dosage and frequency, all from the unstructured text.
class Medication {
  name string
  date string @description("Date format is YYYY-MM-DD")
  dosage string @description("Dosage of the medication")
  frequency string @description("Frequency of the medication")
}

class PatientInfo {
  patient_id string
  medication Medication
  side_effects string[] @description("Do not list intensity or frequency of the side effect")
}

function ExtractMedicationInfo(notes: string) -> PatientInfo[] {
  client OpenRouterClaude35Sonnet
  prompt #"
    Extract the medication information from the following nurse's notes.
    Include only documented side effects, not vital signs or observations.
    When listing side effects, do not describe its intensity or frequency.
    ONLY list the name of the side effect.

    {{ ctx.output_format }}

    {{ _.role("user") }} {{ notes }}
  "#
}

test TestNegation {
  functions [ExtractMedicationInfo]
  args {
    notes #"
      Patient ID: L9M2W
      Date: November 3 2024
      Medication: Metformin 1000mg BID
      Side Effects: Reports mild nausea after morning dose. Denies diarrhea. Blood sugar levels stable.
    "#
  }
}
Note how we explicitly state in both the system prompt and the description annotation in BAML, that we only want the name of the side effect, not its intensity or frequency.
LLMs tend to err on the side of verbosity and provide more information when it’s available, as their goal is to be helpful. In this case, we only want
the name of the side effect so that we can map it to the Symptom node in our graph. With BAML’s schema design, we are easily able to
separate out the relevant metadata about the patient that can also be stored as properties in our nodes or relationships in the graph.
In the result, we once again get a perfectly valid JSON output from the LLM. Note how the date format is correctly
transformed by the LLM to ISO-8601 (YYYY-MM-DD) format thanks to the @description annotation in the BAML model.
[
    {
        "patient_id": "L9M2W",
        "medication": {
            "name": "Metformin",
            "date": "2024-11-03",
            "dosage": "1000mg",
            "frequency": "BID"
        },
        "side_effects": [
            "nausea"
        ]
    }
]
That’s it! We now have two sets of clean structured outputs from the LLM, which we can use to construct a graph in Kuzu.
3. Polars transformations
Kuzu implements a structured property graph data model, where you have the concept of tables (rather than “labels” if you’re coming from the labelled-property graph, or LPG world). To bulk-ingest large amounts of data very quickly into Kuzu node and relationship tables, we can use Polars, a fast DataFrame library that transforms and cleans the nested JSON data from BAML. The transformed DataFrames can be scanned by Kuzu (through the PyArrow interface) and ingested into the respective node and relationships tables.
The full code for the Polars transformations is available in the GitHub repo, but for
reference, here’s a snippet of code that shows how simple it is to transform JSON into Polars DataFrames (which
have great support for nested data, i.e., structs). The example shows how to extract the brand names from the
nested drug struct in the JSON data, that we can then bulk-ingest to the DrugBrand node table in Kuzu.
import polars as pl

# Read the JSON file
df = pl.read_json("drugs_1.json")

# Extract drug brand name nodes from the nested structure
brand_drugs_df = (
    df.explode("drug")
    .select(pl.col("drug").struct.field("brand_names").alias("brand_names"))
    .explode("brand_names")
    .filter(pl.col("brand_names") != "")  # Filter out empty brand names
    .select(pl.col("brand_names").str.to_lowercase())
    .unique()
)
4. Persist to Kuzu
Once we have the Polars DataFrames ready, we create the necessary node and relationship tables in Kuzu that conform to our desired graph schema.
# Node tables
conn.execute("""CREATE NODE TABLE IF NOT EXISTS DrugGeneric (name STRING PRIMARY KEY)""");
conn.execute("""CREATE NODE TABLE IF NOT EXISTS DrugBrand (name STRING PRIMARY KEY)""");
conn.execute("""CREATE NODE TABLE IF NOT EXISTS Symptom (name STRING PRIMARY KEY)""");
conn.execute("""CREATE NODE TABLE IF NOT EXISTS Condition (name STRING PRIMARY KEY)""");
# Relationship tables
conn.execute("""CREATE REL TABLE IF NOT EXISTS CAN_CAUSE (FROM DrugGeneric TO Symptom)""");
conn.execute("""CREATE REL TABLE IF NOT EXISTS HAS_BRAND (FROM DrugGeneric TO DrugBrand)""");
conn.execute("""CREATE REL TABLE IF NOT EXISTS IS_TREATED_BY (FROM Condition TO DrugGeneric)""");
Because our primary key in this case is the name field, and there are multiple drugs
that treat the same condition, we will need to use a MERGE operation rather than
the normally used COPY FROM operation. The good news is, merging data is incredibly simple and fast
when working with DataFrames! Here’s a sample Cypher query that shows how to bulk-merge the
relationsip data between the Condition and DrugGeneric nodes.
LOAD FROM condition_drug_df
MATCH (d:Condition {name: condition}), (g:DrugGeneric {name: generic_name})
MERGE (d)-[:IS_TREATED_BY]->(g)
RETURN COUNT(*)
No for loops required!
Query the graph using Cypher
We now have a graph in Kuzu! Let’s open Kuzu Explorer, and enter the following Cypher query:
MATCH (a)-[b]->(c)
RETURN *;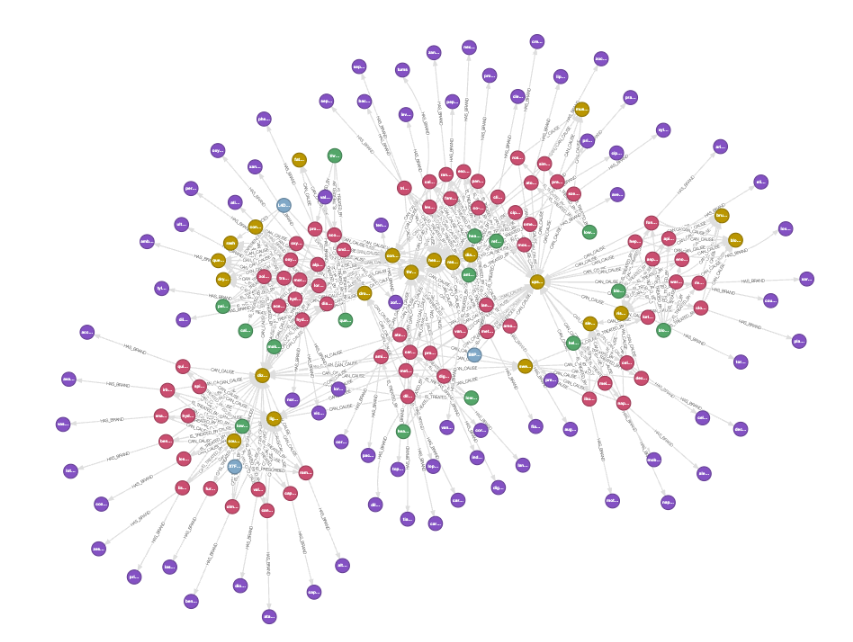
Some natural clusters emerge in the data, as certain classes of drugs have common or shared side effects. Using a graph, we can understand which patients that take a particular dosage of a drug experience common side effects, and traverse further down a path to understand the known side effects of a drug and what brands they are associated with. Here’s an interesting query that we can ask:
Patient with ID “B9P2T” experienced an upset stomach while taking 30 mg Lansoprazole. What other drugs are associated with this side effect so that I don’t prescribe them to this patient?
MATCH (p:Patient {patient_id: "B9P2T"})-[:EXPERIENCES]->(s:Symptom),
      (d:DrugGeneric)-[:CAN_CAUSE]->(s),
      (d)-[:HAS_BRAND]->(b:DrugBrand)
WHERE LOWER(s.name) = "upset stomach"
RETURN d.name AS generic_name, COLLECT(b.name) AS brand_names, s.name AS side_effect;| Generic Name | Brand Names | Side Effect |
|---|---|---|
| clopidogrel | [“plavix”] | upset stomach |
| rivaroxaban | [“xarelto”] | upset stomach |
| levofloxacin | [“levaquin”] | upset stomach |
| vancomycin | [“vancocin”] | upset stomach |
| diltiazem | [“cardizem”,“dilacor xr”,“tiazac”,“cartia xt”] | upset stomach |
| metoprolol | [“toprol xl”,“lopressor”] | upset stomach |
| fondaparinux | [“arixtra”] | upset stomach |
| carvedilol | [“coreg”] | upset stomach |
| clindamycin | [“cleocin”] | upset stomach |
| simvastatin | [“zocor”] | upset stomach |
This sample query shows the power of thinking about the data as a graph — by bringing together multiple heterogeneous data sources, we can ask useful questions about the data that consider the relationships between entities.
Evaluation
Because LLMs are not deterministic (and every LLM is different), it’s always a good practice to quantitatively evaluate the LLM’s output for the given prompt. As new LLMs become available and the prompts evolve alongside them, a sound evaluation suite gives you confidence that the required task is still being performed reliably. The code for the evaluation results shown below is available here.
We defined 4 metrics based on set operations to evaluate the quality of the LLM’s structured output from BAML:
- The LLM’s value is an exact match to the human-annotated value
- The LLM’s value is different from the human-annotated value
- The LLM missed the value and produced an empty result
- The LLM produced a value that is not present in the human-annotated data.
The last metric is named “potential” hallucination because the LLM could have also produced a correct value that’s from its memorization of the training data (which is different from an outright hallucination). This opens up an interesting thought exercise: In cases where the data was publicly available, can LLMs help us enrich our raw data with added knowledge that wasn’t in the source?
In our experiments, we repeatedly found instances of “perfect” memorization in models like
gpt-4o-minifor this drug dataset because it’s clearly seen it during its training. The model was biased towards correcting the spellings of misspelled drug names from the image provided (thus enhancing the quality of the output), and in other cases, the models outright produced the correct brand names for generic drugs, even though those brand names were not mentioned in the source image.
All this being said, anything that’s marked as a potential hallucination during the evaluation stage needs to be vetted and verified by a human so the fewer the better!
Image extraction
Using the gpt-4o-mini model in the image extraction task, the following raw counts for each metric are obtained.
The higher the number of exact matches, the better the model was at the task.
| Model | Date | Exact Match | Mismatch | Missing | Potential Hallucination |
|---|---|---|---|---|---|
openai/gpt-4o-mini | Mar 2025 | 170 | 0 | 2 | 11 |
Upon inspecting the potential hallucinations, it’s clear that the LLM produced many of them from its memorization of the training data. Because the memorization was so good, the model repeatedly produced the same correct result, even when running the code dozens of times. Below, we list the LLM’s potential hallucinations from its extractions from page 2 of the PDF:
File: drugs_2.json
Potentially hallucinated items in extracted data (please verify):
<Missing> (human annotated) --- 'Accupril' (extracted)
<Missing> (human annotated) --- 'Altace' (extracted)
<Missing> (human annotated) --- 'Capoten' (extracted)
<Missing> (human annotated) --- 'Cardizem' (extracted)
<Missing> (human annotated) --- 'Co-Trimoxazole' (extracted)
<Missing> (human annotated) --- 'Lotensin' (extracted)
<Missing> (human annotated) --- 'Prinivil' (extracted)
<Missing> (human annotated) --- 'Trimethoprim' (extracted)
<Missing> (human annotated) --- 'Vasotec' (extracted)
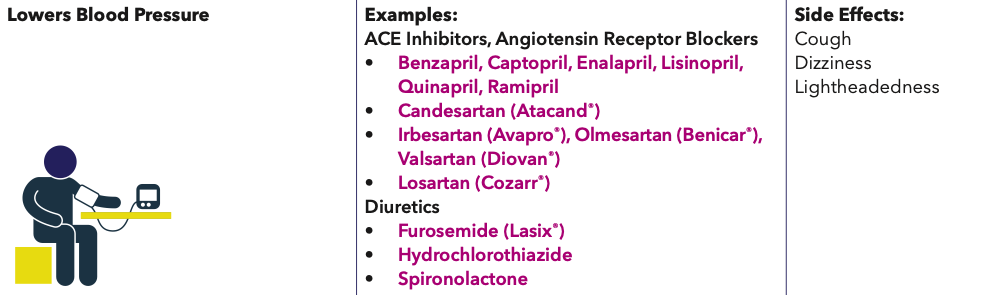
<Missing> (human annotated) --- 'Zestril' (extracted)Although the human-annotated data did not mention brand names of ACE inhibitor drugs (that lower blood pressure),
the LLM “extracted” them from its internal memorized knowledge, and correctly associated that Altace is the brand name for the generic drug Ramipril, and so on.
Trimethoprim from the above list was incorrectly extracted — it was present in the original image as “Co-Trimoxazole, Sulfamethoxazole/Trimethoprim”,
but the multiline formatting of this snippet of text in the image is likely the reason the LLM missed it.
All it took was a quick inspection of these 11 values, and we can remove 9 of them from the list of potential hallucinations. Much better! 🚀
| Model | Date | Exact Match | Mismatch | Missing | Potential Hallucination |
|---|---|---|---|---|---|
openai/gpt-4o-mini | Mar 2025 | 170 | 0 | 2 | 2 |
Next, we inspected the missed and mismatched values from gpt-4o-mini to see if there are any common patterns
that can be identified to understand the LLM’s performance.
File: drugs_2.json
  Items missing from extracted data:
    'Co-Trimoxazole, Sulfamethoxazole/Trimethoprim' (human annotated) --- <Missing> (extracted)
    'Furosemide' (human annotated) --- <Missing> (extracted)
    'Hydrochlorothiazide' (human annotated) --- <Missing> (extracted)
    'Spironolactone' (human annotated) --- <Missing> (extracted)

File: drugs_2.json
  Mismatched items (different values for corresponding elements):
    'Cardizem CD' (human annotated) --- 'Tiazac' (extracted)
    'Digitek' (human annotated) --- 'Digitex' (extracted)
The reason for these mistakes is that gpt-4o-mini got confused with the formatting of the text in the image where the diuretic drugs
Furosemide, Hydrochlorothiazide and Spironolactone are listed. Similarly, it didn’t correctly extract
the two brand names for Digoxin (it got Digitek but missed Lanoxin). Some simple prompt engineering
with example few-shot prompts that show the LLM examples with the word “or” in the brand names could
help address this.
How do larger models, like openai/gpt-4o and anthropic/claude-3.5-sonnet perform
with the same prompt on the same task? They do expectedly well, but at an added cost.
| Model | Date3 | Exact Match | Mismatch | Missing | Potential Hallucination | Cost | Cost factor |
|---|---|---|---|---|---|---|---|
openai/gpt-4o-mini | Mar 2025 | 170 | 0 | 2 | 24 | 0.0008 | 1.0 |
openai/gpt-4o | Mar 2025 | 174 | 1 | 1 | 2 | $0.0277 | 35x |
anthropic/claude-3.5-sonnet | Mar 2025 | 173 | 0 | 2 | 2 | $0.0551 | 69x |
google/gemini-2.0-flash | Mar 2025 | 158 | 2 | 12 | 8 | Free tier | N/A |
The best results (most exact matches) were from openai/gpt-4o,
but at nearly 35x the cost of openai/gpt-4o-mini. The next-best results from anthropic/claude-3.5-sonnet
are comparable to openai/gpt-4o-mini, but at 69x the cost. openai/gpt-4o-mini gave a really
high number of exact matches, while also being 30x-70x cheaper to run5
than the other models tested. google/gemini-2.0-flash
was significantly less accurate in this case (it seemed to have trouble detecting comma-separated items
in the image from the given prompt), so it may need a bit more prompt engineering to
perform better on this task — that’s an exercise for another day!
Text extraction
For the text extraction task on the clinical notes, all models performed excellently, with zero error rates across all metrics and over dozens of runs.
| Model | Date3 | Exact Match | Mismatch | Missing | Potential Hallucination | Cost | Cost factor |
|---|---|---|---|---|---|---|---|
openai/gpt-4o-mini | Mar 2025 | 19 | 0 | 0 | 0 | $0.0003 | 1.0 |
openai/gpt-4o | Mar 2025 | 19 | 0 | 0 | 0 | $0.0044 | 15x |
anthropic/claude-3.5-sonnet | Mar 2025 | 19 | 0 | 0 | 0 | $0.0074 | 25x |
google/gemini-2.0-flash | Mar 2025 | 19 | 0 | 0 | 0 | Free tier | N/A |
“Reports mild nausea after morning dose. Denies diarrhea. Blood sugar levels stable.”
In the above example, all the LLMs tested were able to correctly (and reproducibly) detect negation, i.e., “denies” means that the patient did not experience diarrhea, and this side effect was excluded from the output. A more extensive evaluation test suite can be created this way using BAML to understand the capabilities of smaller, cheaper models on these kinds of tasks.
Conclusions
Let’s digest the key takeaways from this post, because we’ve covered a lot!
First, LLMs have long been viewed as “unreliable” and untrustworthy in their outputs, and the task of extracting structured data from unstructured data has long been entrusted to rule-based (or more recently, NLP-based) systems. By providing the LLM prompt a schema and a type system, as we did in BAML, we are able to solve a non-trivial structured data extraction task from an image with a single prompt. The quality of the results were more than acceptable, and the cost was tiny relative to the amount of development effort. Granted, the results aren’t perfect, but for any real-world use case, it’s helpful to build an initial pipeline this way, learn how the prompt affects the output, and iterate on your ideas this way. You’d be surprised how good modern LLMs are at a variety of tasks, especially when prompted the BAML way!
By processing images of PDF data (rather than the PDFs themselves6), the approach shown in this post minimizes the need for custom pre/postprocessing code on the client side. The BAML prompts themselves are concise, readable, maintainable, most importantly, testable. Using BAML, it was very easy to rapidly iterate on the prompts and build an understanding of various LLMs’ performance on the task.
From a Kuzu perspective, the benefits of using LLMs alongside graphs and graph databases have been made abundantly clear in this post — we are able to bring together separate datasets cohesively into a single knowledge graph, enabling users to ask complex queries about drugs, patients, and side effects. Hopefully, this gets you thinking about how to structure your own data as a graph!
Evaluation is an important step when developing with LLMs, and we defined 4 metrics based on set operations to gauge the
quality of the LLM’s structured outputs for image and text extraction, and
found that even small and low-cost models like openai/gpt-4o-mini can often perform as well as
much larger models in extracting data from images, offering a very cost-effective solution without compromising on performance.
The results obtained here can definitely be improved further with some prompt engineering and pre/postprocessing.
For this study, we didn’t focus too much on optimizing these steps, but you can try this workflow out yourself, even using open source models!
Now that we have a graph to work with in Kuzu, in an upcoming blog post, we will show how to use BAML to build a Graph RAG chatbot on top of the Kuzu database. More experiments and evaluations in Text-to-Cypher and its related prompt engineering will be covered in that post, so stay tuned!
Code
All code to reproduce the workflow end-to-end is available on GitHub. Give it a try with different LLMs/prompts, and let us know what you find!
Footnotes
-
The PDF file of drugs and side effects used in this post is from this flyer from the MedStar health website. ↩
-
The images are exported at a resolution of 200 DPI, which seems to be more than enough for most multimodal LLMs to disambiguate the text fields in the image, while also not adding significantly to the the token count. ↩
-
The date specified in the results table is the rough date when the experiments were run. As we know, models continually evolve over time so these numbers may not be reflective of the current state of the models as you’re reading this. ↩ ↩2
-
The original output showed 11 potential hallucinations, but 9 of these were from the
gpt-4o-minimodel’s memorization of the training data, and they actually enhanced the quality of the output by providing more information than was present in the original image. This might be considered a good thing! ↩ -
The
openai/gpt-4o-minimodel’s costs per token vary over time, and newer, cheaper models are released regularly. These numbers are just a measure of how cheap LLMs are becoming for the quality of results obtained. ↩ -
In the future (if it’s not happened already as you’re reading this), it’s possible that BAML will natively support the
pdfdata type, which will make the image extraction step redundant. ↩