LLMs have revolutionized the way we interact with data due to their convenient natural language interface, and as we know, their versatility makes them useful in various stages when building chatbots and question-answering systems. In this blog post, I’ll walk through an end-to-end application that addresses the three stages of Graph RAG, highlighting how LLMs play a role at every stage, even if these stages are functionally very different from each other.
First, let’s give a definition to the term “Graph RAG”, which has been making waves throughout 2024. In my conversations with the community, I’ve found that this term can mean different things to different people. I find the following statement to be useful in explaining the concept: “Graph RAG is a form of Retrieval-Augmented Generation (RAG) in which the retrieval step is based on a graph, and this retrieved context from the graph is used by an LLM to generate the response”. From a design and implementation standpoint, I like to think of any practical Graph RAG pipeline as having the following three stages:
- Knowledge Graph (KG)1 Construction: Combine a mix of unstructured and structured data sources to construct a KG that can then provide LLMs with the relevant context for answering questions about the data. In the sections below, I’ll show how to use an LLM at this stage to extract entities from the unstructured data and augment the KG with these entities, though I will also mention some alternatives to this approach towards the end of the post.
- Retrieval: Query the KG via a Text2Cypher pipeline that uses an LLM to generate syntactically correct Cypher queries based on the user question. I’ll discuss the prompting strategy used to generate Cypher which is then run on the graph database to retrieve the relevant nodes and relationships from the graph.
- Generation: Use the retrieved results as context for an LLM prompt to generate a response in natural language to the user question. I’ll also show a chatbot UI written in Streamlit that helps users to interact with the application via a chat interface.
We will use Kuzu as the underlying graph store for the application. The steps shown in this blog post can serve as a blueprint for similar applications on your own data. Along the way, I hope it becomes clear how useful Kuzu can be for facilitating the rapid iteration and experimentation that is required for building more robust Graph RAG pipelines!
Problem definition
The dataset used for this case study is a real-world dataset of talk transcripts from past Connected Data London presentations. CDL is a leading graph-focused conference that brings together professionals in the fields of semantic technologies, knowledge graphs, databases, data science, and AI. From a Kuzu perspective, one of the highlights of the event was the Connected Data Knowledge Graph (CDKG) challenge. The challenge originated from a round table discussion in July 2024, in which a proof-of-concept Graph RAG application was demonstrated, that utilized a graph constructed from the unstructured text of talk transcripts from past Connected Data London conferences. However, as is the case with most PoCs, there were numerous issues with the pipeline, such as missing links between entities, missing entity types, and duplicate entities. This led to the creation of the CDKG challenge, described as “A Knowledge Graph for the community by the community”, and it was launched as an open source project in the summer of 2024.
The broader goals of the challenge are to build a curated knowledge graph of the collective wisdom of the material from 260+ experts who have contributed to Connected Data events since their inception in 2016. The curated graph would make it easier to discover, explore, digest, combine and reuse the collective knowledge in the community, and the underlying graph could be made available to the larger community for querying and exploration2.
At Kuzu, we are motivated by the goal of helping developers more easily use graphs in their applications, so we embarked upon the CDKG challenge by tackling each of the three stages of the Graph RAG pipeline listed above.
Stage 1: Graph construction
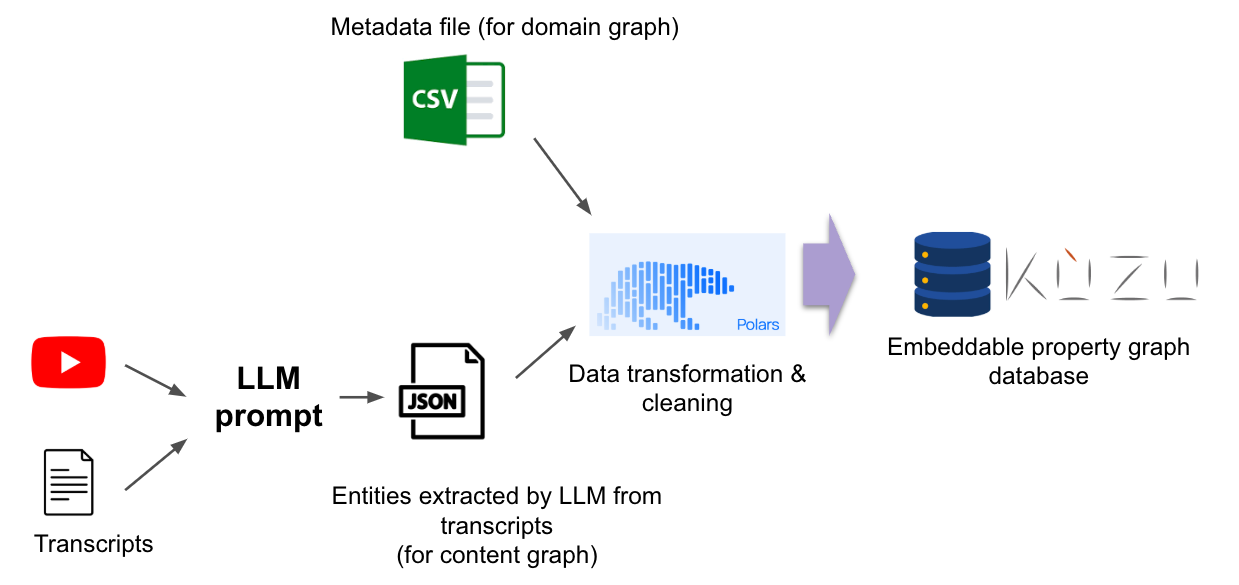
Graph construction is a multi-step process that begins with a deep understanding of the data sources and how the domain knowledge is structured. The following diagram shows the key steps in the process.
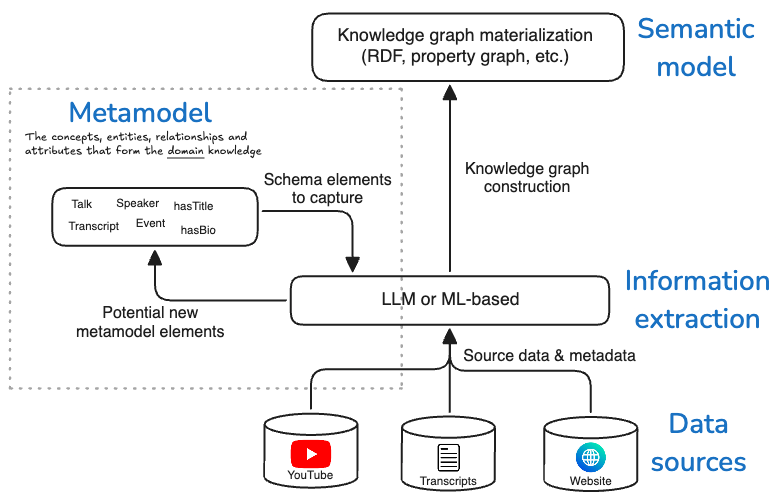
The steps are performed in the following order:
- Obtain data sources and understand them more deeply
- Information extraction via scraping, transcription, LLM or ML-based extraction, etc.
- Metamodel definition (more on this below)
- Semantic model definition for graph construction
Note how the box for the metamodel feeds back into the information extraction box in the diagram above. This is because the metamodel is not static — once defined, it can be extended over time, and additional information extraction steps can be applied to enrich the metamodel, and thus the graph’s contents.
Data sources
To begin with, the CDL team provided participants with a curated metadata file
in .csv format that contains metadata about past events, speakers, talks, and other entities based on the website of the past events.
In addition, we were given the text transcripts of the talks as subtitle (.srt) files that were generated by transcription tools.
The combination of these two data sources: The metadata CSV file, and the .srt files, are what are used
as the data sources for the graph construction phase.
Information extraction
The unstructured text in the .srt files is first preprocessed to remove
the noise, such as timestamps, and the cleaned text is stored in .txt format. These text files contain the raw,
unfiltered text of what each speaker spoke in their talk, and provide useful knowledge about what topic keywords were discussed.
Because multiple speakers can each mention the
same keywords, such as “RDF” or “GraphQL” in their talks, we thought it would be useful to have the Talk entities
in our graph connect to the keywords they mention, so that we can traverse paths in the graph to find
all the speakers who mentioned a particular keyword.
In our case, we used an OpenAI LLM (gpt-4o-mini) to extract keywords of technologies and frameworks
from the text files using an appropriate prompt3 that output the results for each talk in JSON format.
We could, of course, do more prompt engineering to extract even more information from the talk transcripts,
but for this initial implementation, we only extracted keywords of technologies and frameworks that were
mentioned in the talks.
The example below shows the JSON output of the extracted keywords, or Tag entities in our property graph,
for the talk titled “Graph Thinking” by Paco Nathan.
[
  {
    "filename": "Graph Thinking _ Paco Nathan _ Connected Data World 2021.txt",
    "entities": {
      "tag": [
        "rdf",
        "spark",
        "dask",
        "ray",
        "rapids",
        "apache arrow",
        "apache parquet",
        "pyvis",
        "matplotlib",
        "graphistry",
        "networkx",
        "igraph",
        "cugraph",
        "pytorch geometric"
      ]
    }
  }
]
In addition to using LLMs to extract keywords from the talk transcripts, we also considered other ways to scrape additional metadata from the event websites, for example, the speaker affiliations, organization descriptions, etc. However, in the interest of time, this part was left out for the initial implementation.
Metamodel
Because the CDKG challenge is designed to be agnostic to both the graph database and the semantic model used downstream, we first define what we call a metamodel that allows practitioners to more deeply understand the structure of the data before settling on their semantic model — i.e. whether they will model the data using RDF or property graphs.
The metamodel is defined as the set of concepts, entities, relationships and attributes that form the domain knowledge. You can think of the metamodel as a high-level data model that captures how real-world entities (speakers, talks, events, etc.) are related to each other. Defining a metamodel allows you to be truly agnostic to the choice of data model downstream — you can just as well choose to model each entity’s attributes via RDF triples, or as properties on nodes and relationships in a property graph. The metamodel allows you to also formalize the vocabulary of the domain knowledge, such as the names of the entities and relationships and the properties/attributes that describe them. This way, other consumers downstream can use the same vocabulary to understand, describe and query the data.
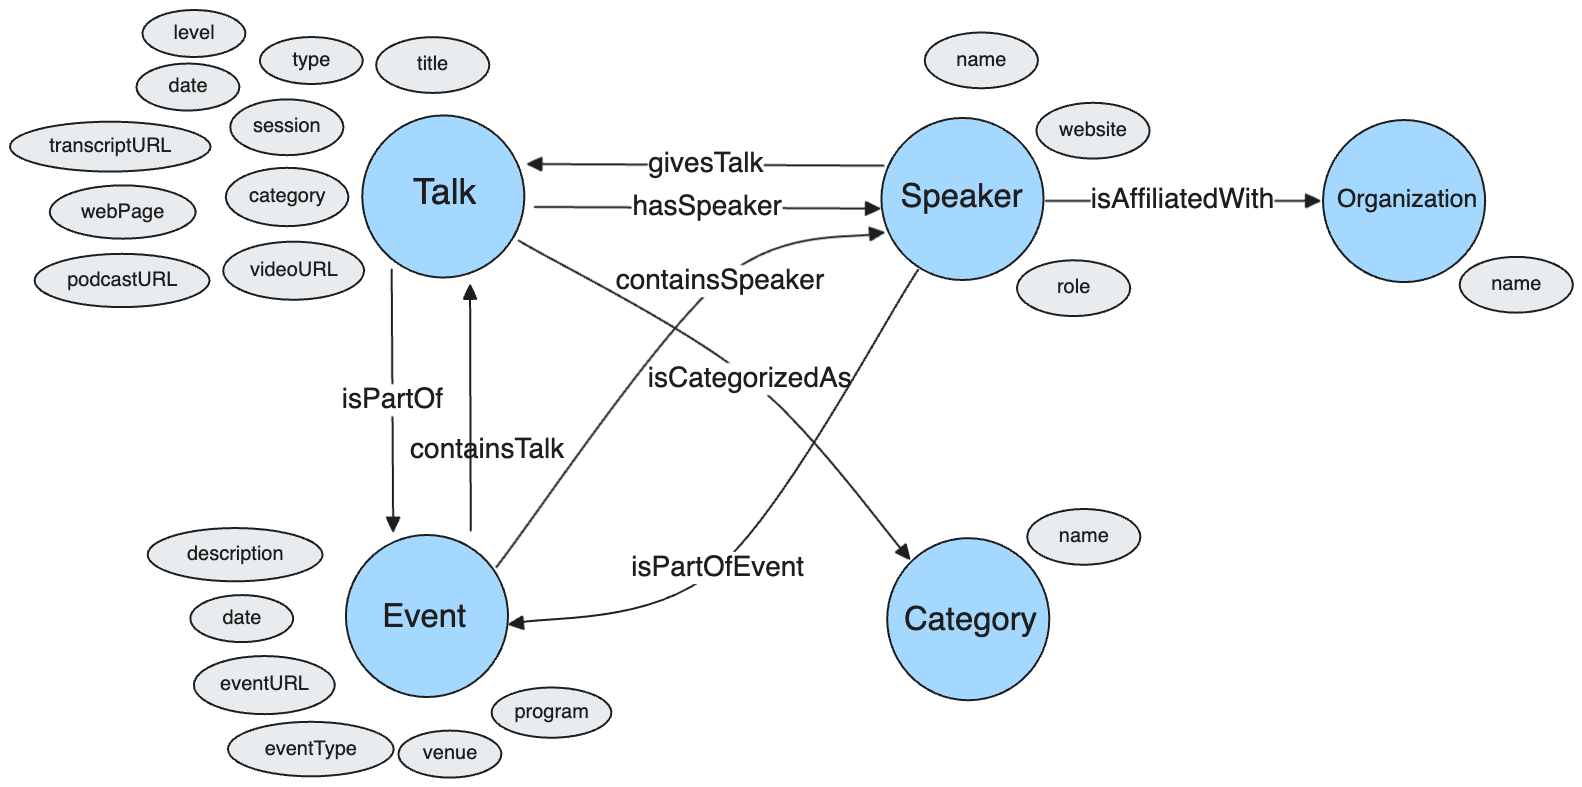
You can see a markdown version of the metamodel here.
As mentioned earlier, the metamodel is not static — it can be extended over time, and
additional information extraction steps can be applied to enrich the metamodel, and thus the knowledge graph itself.
In the above diagram, the initial metamodel is defined using just the columns present in the metadata CSV file.
At a later stage, we update the metamodel to include the keywords (modeled as Tag entities) extracted from the talk transcripts.
Semantic model
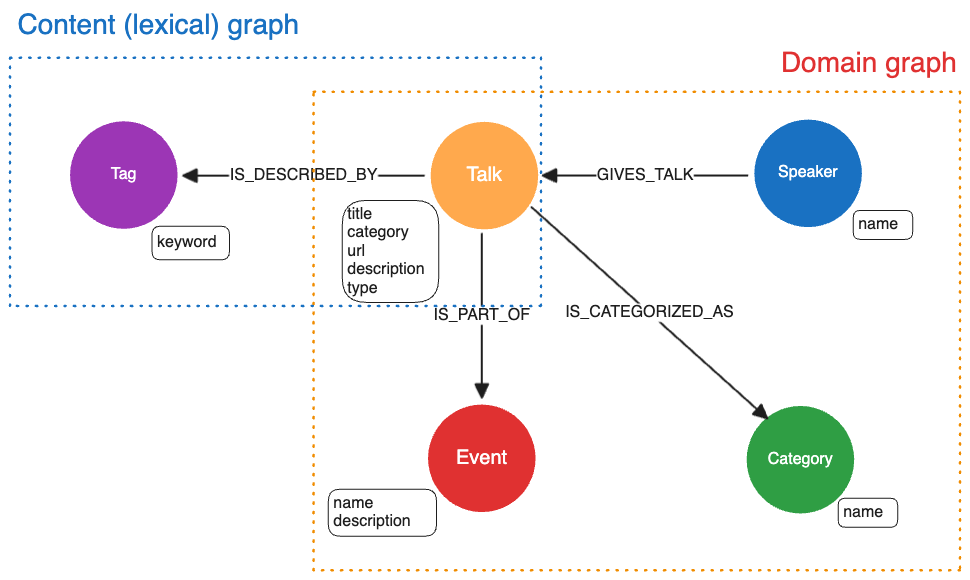
The semantic model expresses the structure of the metamodel using a specific data model, such as RDF or property graphs. Kuzu implements the property graph model, so we choose to express the above metamodel as properties (i.e., key-value pairs) on nodes and relationships in the graph. In general, the semantic model is broken down into two components: the domain graph and the content graph (also known as the lexical graph)4.
Domain graph
The domain graph in Kuzu is constructed using the information provided in the metadata CSV file. Kuzu is an embeddable property graph database that supports Cypher, so it’s relatively straightforward to transform the metamodel into a property graph schema in Kuzu that we can then use to persist the graph in the database. Visually, the property graph schema in Kuzu looks like the following:
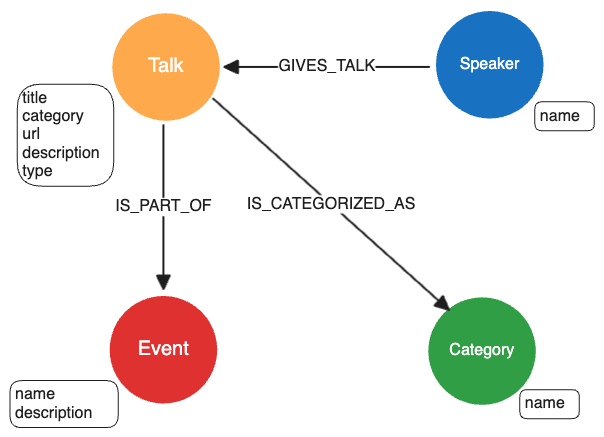
The Speaker, Talk, Category and Event entities are modelled as nodes, and the relevant metadata fields for each
entity as obtained from the metadata CSV file are stored as properties on the nodes. The directions of
the relationships are chosen based on our best judgment for easy querying. For example,
(:Speaker)-[:GIVES_TALK]->(:Talk) is an intuitive way to express that a speaker gives a talk,
both for humans and for LLMs that write Cypher.
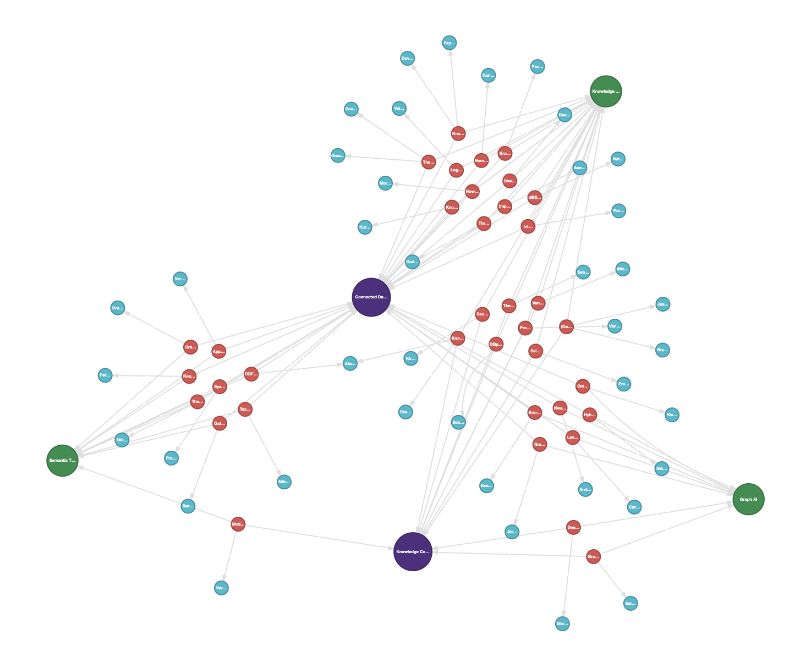
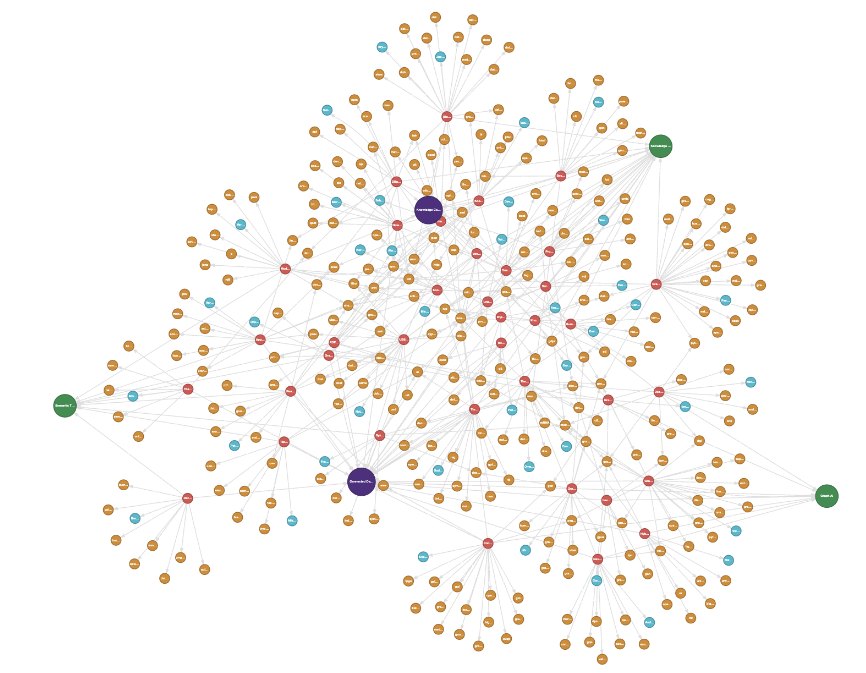
The graph that’s persisted in Kuzu can be visualized in Kuzu Explorer.
In the figure below, the large green nodes represent each talk’s Category (“Graph AI”, “Semantic Technology”, etc.),
and the smaller blue nodes are the Speaker nodes, which are
connected to the red Talk nodes. The purple nodes represent the Event that a talk belongs to. For this
graph, we have two events: “Connected Data World 2021” and “Knowledge Connexions 2020”. Note how there
are clear clusters of talks that belong to the distinct events or a given talk category.
The only missing piece in the domain graph compared to what was shown above in the
metamodel is the Organization that each Speaker is affiliated with. These nodes were not
modelled because it wasn’t straightforward to obtain this information from the Connected Data World
website. This can be addressed via better scraping methods and added to the graph in future iterations of the challenge.
Content (lexical) graph
We extend the metamodel and the domain graph by adding the Tag entities of keywords from the talk transcripts that were extracted
using an LLM, as shown above. The Tag entities are connected to the Talk entities via the IS_DESCRIBED_BY relationship.
The content graph is sometimes referred to as a lexical graph4, because it models relationships between
lexical items (e.g. keywords, entities, etc.) in the text.
Combining the domain graph and the content graph this way gives us a richer view of the data that allows us
to answer queries about talk content, such as “Which speakers gave talks about RDF?”. The full graph
is visualized below, where the orange nodes represent the Tag keywords that are described
by a given Talk.
Implementation
The graph construction workflow in Kuzu consists of a series of Python scripts provided in the GitHub repo. Kuzu’s strong level of integration with the Python AI and data ecosystem is quite clearly visible in this workflow, where we use Polars, a popular DataFrame library in Python, to transform and manipulate the metadata CSV file as per our desired data model and seamlessly ingest the DataFrame contents into the database. We can do a similar thing for the JSON file containing the extracted keyword terms.
Note how straightforward it is to use Kuzu’s COPY FROM
command to bulk-ingest the contents of the Polars DataFrame into the database in a single line of code, as shown below.
# Read the metadata CSV file
df = pl.read_csv(filepath).drop_nulls()

# Transform the DataFrame to extract the unique speakers
# Handle the case where multiple speakers are listed in a single CSV value
speakers_df = (
    df.select("Speaker")
    .with_columns(pl.col("Speaker").str.replace_all(" & ", " and "))
    .with_columns(pl.col("Speaker").str.split(" and "))
    .explode("Speaker")
    .with_columns(pl.col("Speaker").str.strip_chars())
    .drop_nulls()
    .unique()
)
# Bulk-ingest the transformed DataFrame directly into the database
conn.execute("COPY Speaker FROM speakers_df")
Stage 2: Retrieval
Let’s now use the Kuzu graph to answer some questions about our data! We’ll apply a technique called Text2Cypher, which uses an LLM to generate Cypher queries from the question posed in natural language. The Cypher query is then run in Kuzu to retrieve the relevant nodes and relationships from the graph. To ensure that we generate syntactically correct Cypher, we pass the schema of the graph as context to the LLM’s prompt5.
The following image demonstrates this using the example question “Which speakers gave talks about RDF?”. Due to
the prompts used, the gpt-4o-mini LLM is able to generate syntactically correct Cypher queries that respect
the schema of the graph, so that we can answer a variety of questions about the data in this manner.
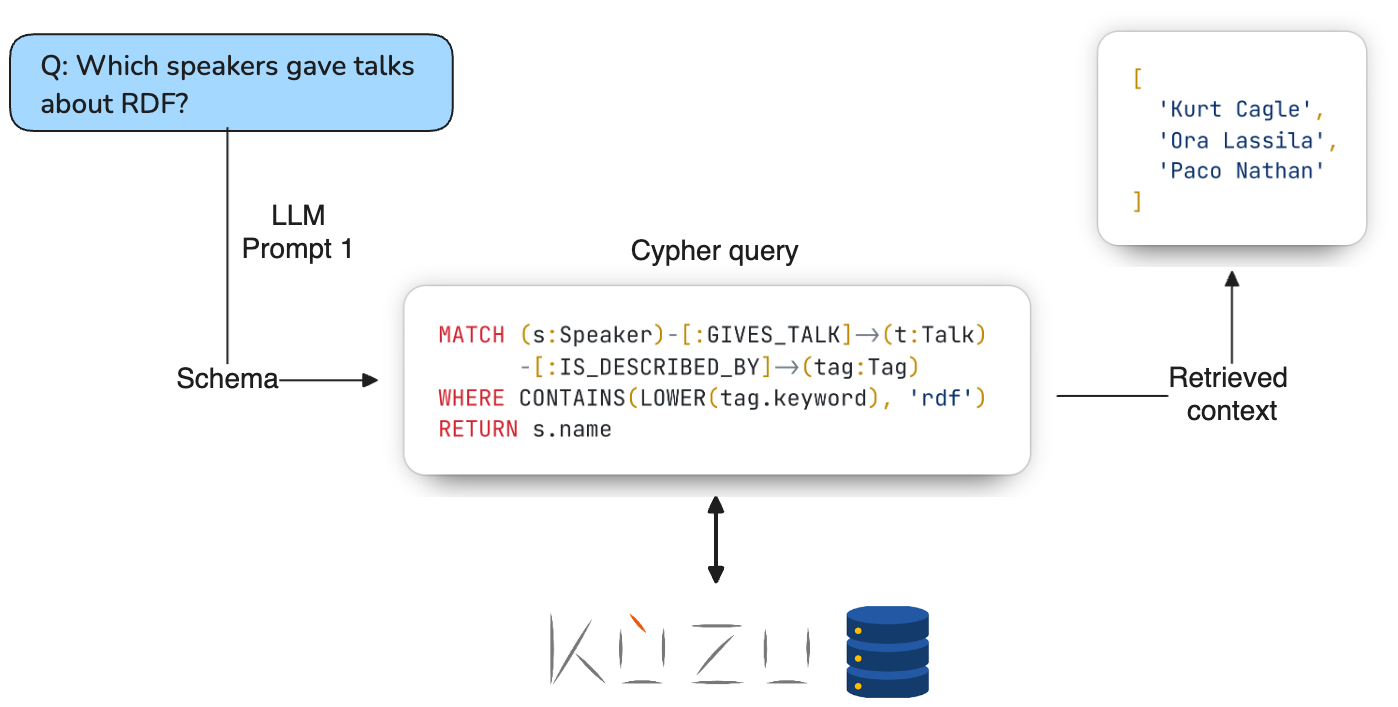
As can be seen in the examples below, our prompt engineering5 worked reasonably well for a variety of questions like these!
Q1: Which speakers gave a talk whose title contains the term ‘Knowledge Mesh’? Please give the talk’s full title and the names of the speakers.
MATCH (s:Speaker)-[:GIVES_TALK]->(t:Talk)
WHERE CONTAINS(LOWER(t.title), 'knowledge mesh')
RETURN t.title, s.name
The talk titled "Knowledge Mesh: From Data Silos to Data Fabric at Global 2000 Enterprises" was given by speakers David Amzallag and Szymon Klarman.This example locates a partial match on the talk title using the CONTAINS and LOWER functions in Kuzu’s Cypher,
and returns the talk’s title and the names of the speakers as requested in the question.
Q2: What was discussed in the talk by Paco Nathan?
MATCH (s:Speaker)-[:GIVES_TALK]->(t:Talk)
WHERE LOWER(s.name) = 'paco nathan'
RETURN t.title, t.description
In the talk by Paco Nathan, titled "Graph Thinking," he explored the concept of Graph Thinking as a method for conceptualizing problems that can be addressed using graph technologies. The discussion included parallels to learning theory, illustrating how individuals organize knowledge into graph-like structures as they advance from novice to expert in a field.
Nathan introduced intuitive examples that demonstrate the capabilities and trade-offs of graph technologies, aimed at domain experts to help initiate new graph projects. He shared insights gained from business use cases in industrial AI within the EU, focusing on overcoming cognitive challenges organizations encounter during large graph initiatives.
The talk also reviewed common industry use cases and discussed how graph data science practices can be implemented using Python open source tools. Additionally, Nathan presented the 'kglab' abstraction layer, which integrates various libraries into the PyData stack for enhanced graph technology utilization.This example locates the talk by Paco Nathan using the LOWER function to match on the speaker’s name, and returns the talk’s title and description.
The description property is a free-form text field that’s provided as context to the generation LLM, so it is able to use this information to answer the question.
Q3: Can you tell me more about the event Connected Data World 2021?
MATCH (e:Event) WHERE LOWER(e.name) = 'connected data world 2021' RETURN eConnected Data World 2021, previously known as Connected Data London, is a premier event focused on Knowledge Graphs, Graph Data Science, AI, Graph Databases, and Semantic Technology. The event aims to bring together leaders and innovators in these fields, providing a platform to share insights and a visionary outlook on Graph as a foundational technology stack for the 2020s.This question matches a single Event node by its name property, and returns the event’s description property as requested in the question.
Once again, the LLM is provided the relevant context via the description property of the Event node, so it is able to successfully answer the question.
Stage 3: Generation
During the generation stage, the retrieved results from the graph database are passed as context to another LLM’s prompt to generate a response to the question6. To help the LLM remember the question, the question is repeated in the prompt. The figure below shows an example of how the generation LLM uses the retrieved context for the question “Which speakers gave talks about RDF?”. The speaker names are passed as a list of strings in the prompt’s context, so that the LLM can then generate a natural language response that includes the names of the speakers.

To make the RAG portion of the pipeline (stages 2 and 3) more easily accessible, we can wrap the underlying classes and methods in a simple chatbot UI using a library like Streamlit. The Streamlit UI for this project includes additional components to store the chat history and display the LLM-generated Cypher query, so that it’s more transparent to the user what query is being run on the Kuzu database.
The streamlit app can be run locally using the following command:
streamlit run app.pyBelow is an example of the Streamlit UI in action. The code for the Streamlit chatbot UI can be found here.
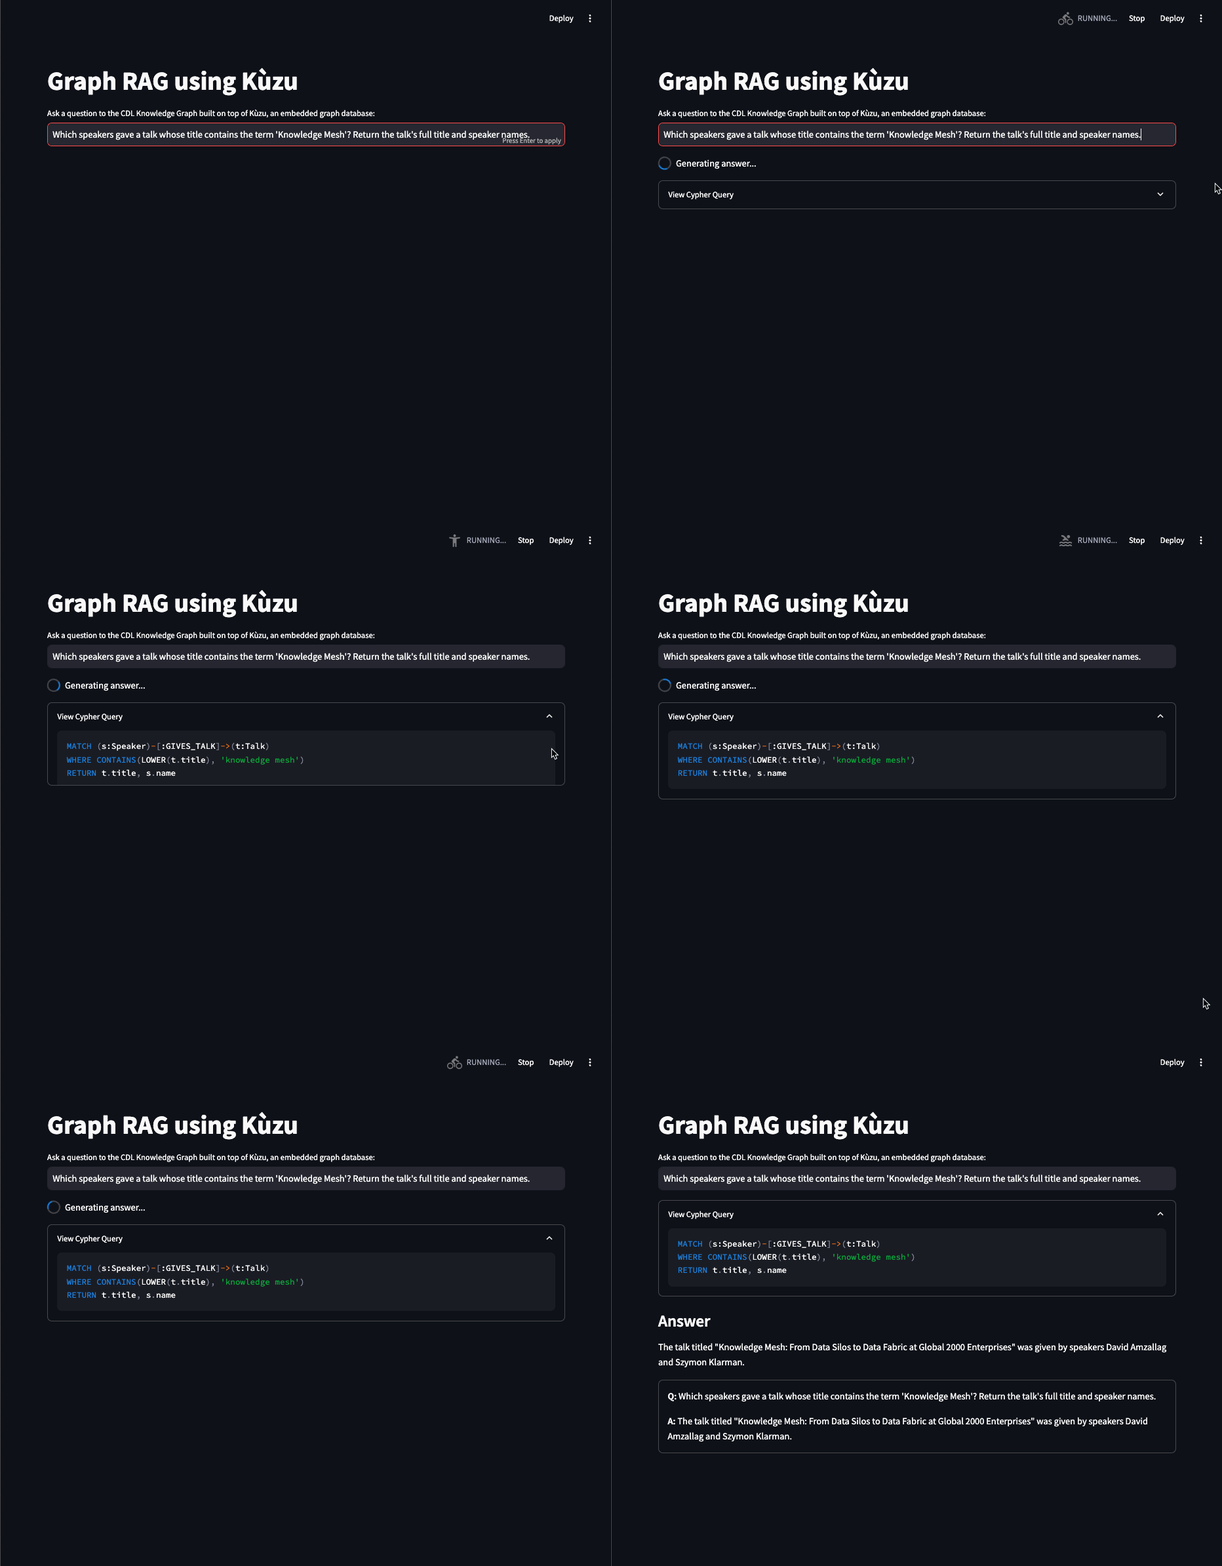
That’s it! We’ve successfully built a Graph RAG application on top of a Kuzu database that can answer questions about the data via a chatbot interface.
Limitations and future work
The Graph RAG pipeline used in this case study is not perfect. If the user question is phrased using terminology that’s not present in the graph, or specified in partial form (e.g., “Connected Data World” instead of “Connected Data World 2021”), the LLM may not be able to resolve the question correctly and may write an incorrect Cypher query, resulting an empty retrieval response. In such cases, some fallback mechanism is needed to either rewrite the query in a different form, or it may be necessary to use an additional retrieval method, such as vector or keyword-based search to answer the question. Note that not all LLMs are are created equal, so it’s important to choose a good LLM that can generate syntactically correct Cypher queries, and then tune the Text2Cypher pipeline in a way that minimizes the chances of a empty response from the graph database.
As a next step, it’s definitely worth extending the Graph RAG pipeline shown to include vector embeddings of the unstructured text of the talk transcripts, as this will improve the quality of the retrieval in cases where the graph traversal does not yield a response. On that note, Kuzu is on the verge of releasing a native disk-based HNSW vector index that allows users to run similarity search queries in Cypher, so this will be a useful future addition to the Graph RAG pipeline. Stay tuned for more updates on this in a future blog post!
If you’ve worked on traditional RAG applications before, you’ve likely defaulted to using vector search as the go-to retrieval method. I hope that this blog post has shown that it’s also possible to start with a curated KG for the retrieval step in cases like this where the underlying data has inherent structure, and add on vector search to enhance the retrieval from the graph. With a sufficiently high quality graph, it’s possible to answer a surprisingly wide range of questions using just the graph, an appropriately designed Text2Cypher pipeline, and some basic prompt engineering!
In summary, there are numerous ways to improve the Graph RAG pipeline shown here. Some examples include:
- Extract other kinds of entities (e.g. people, places, organizations) and relationships from the transcripts using alternative LLMs
- Extract more metadata from the data sources and add them to the domain graph to help answer more complex questions
- Explore vector search strategies in combination with the graph traversal
- Add better fallback mechanisms for cases where the graph traversal does not yield a response, via agentic frameworks like LangGraph that themselves use graph-based workflows to direct the user query to the appropriate retrieval method
Key takeaways
Recall that we began building our Graph RAG application by first defining a metamodel that captured the high-level structure of the data, before expressing the semantic model, i.e., the domain and content graphs in Kuzu. When applying this approach to your own data, it’s important to spend enough time becoming deeply familiar with the data and the domain, so that you can (1) gather the right data; (2) define a standardized vocabulary; and (3) decide on the right semantic model that helps you answer the kinds of questions you want to ask.
We showed how to construct a graph based on this metamodel by combining the structured data (domain graph) with the keywords terms extracted from the unstructured talk transcripts (content/lexical graph) that can then answer a range of questions via a natural language interface. The general principles of graph construction shown in this case study, such as the vocabulary around “domain graph” and “lexical graph”, are becoming more widely adopted in the Graph RAG community4, and apply to other data sources than the one discussed here.
Importantly, we showed how LLMs can play a key role at each stage of the Graph RAG pipeline, from knowledge graph construction to retrieval and generation. First, we used an LLM to extract keywords from the talk transcripts. Next, we used another LLM to generate Cypher queries that can answer questions about the data. Finally, we used a third LLM to generate a response to the question posed by the user. I will state here, however, that it’s not necessary to use an LLM for the first stage — depending on the domain-specificity of the data, general purpose LLMs may not suit your needs for information extraction. It’s worth exploring other ML or NLP-based extraction methods, such as GliNER for entity extraction or ReLiK for relationship extraction during this stage.
Hopefully, the techniques shown in this blog post provide some ideas on how to use Kuzu to build your next Graph RAG application. Feel free to browse through the code and the prompting strategies used in the project’s GitHub repo, or better yet, please contribute to future iterations of the CDKG challenge by augmenting the graph with more metadata, or by adding more sophisticated retrieval and generation methods. And if you’re using Kuzu, do reach out to us on Discord if you have any interesting observations or implementations of your own to share!
Acknowledgements
This work was the result of many months of fruitful discussion with my collaborators: George Anadiotis from the Connected Data London team (who is also responsible for initiating this challenge), Fidan Limani and Dennis Irorere. Many thanks to them for their contributions in the metamodelling and experimentation phases of this implementation.
All code and prompts used in this case study are available in the GitHub repo.
Footnotes
-
The term “knowledge graph” used throughout this post is used in a general sense, and does not refer to a specific data model. Any reference to “knowledge graph” in relation to Kuzu refers to the underlying property graph, which is the data model expressed by Kuzu. ↩
-
The KG that was built via this exercise, as well as its future variants, will be made available to the larger community for querying and exploration. The format of the KG is still being decided, but the large goal is to make it accessible to users regardless of their technology stack — at most, some data transformation scripts might need to be written to store the KG in a database of the end user’s choice. Stay tuned to the project’s GitHub repo and file an issue there if you’d like to obtain the KG for your own use. ↩
-
You can see the custom prompt that used to extract keywords from the talk transcripts and output the results to JSON format here. The
elllanguage model prompting framework was used for this task. A temperature of 0.0 was used for the LLM to reduce the chance of the LLM hallucinating keywords that were not actually mentioned in the talk transcript. The system and user prompts clearly specify the task and the format of the output, and thegpt-4o-miniLLM is able to extract the keywords reasonably well. ↩ -
graphrag.com is an open knowledge sharing initiative that aims to catalog the various Graph RAG patterns and methodologies. The vocabulary on “domain graph” and “lexical graph” is inspired by the terminology used in this website, so we encourage you to read more about the different patterns and techniques that the larger Graph RAG community is exploring via this site. ↩ ↩2 ↩3
-
The system and user prompts used for the
gpt-4o-miniLLM that generates the Cypher queries can be found in this file. Once again,ellis the LLM prompting framework used. The temperature is once again set to 0.0 to reduce the chance of the LLM hallucinating property names, node labels, and relationship labels. Some Kuzu-specific syntax and functions are specified in the user prompt to help the LLM generate syntactically correct Cypher — for example, theLOWERfunction is required to match the case-insensitive nature of property names, and theCONTAINSfunction is used to match on substrings in the the specified part of the query. ↩ ↩2 -
The system and user prompts specified via
ellfor thegpt-4o-miniLLM that generates the response to the question can be found in this file. For text generation, we set the temperature to be 0.3 to encourage the LLM to generate a more conversational response. As in most RAG pipelines, the system prompt in this case very explicitly instructs the LLM to only use the provided context to answer the question, and not to make up the answer. ↩


