Today, we are happy to announce the release of KùzuExplorer, a browser-based frontend for Kuzu to visualize and explore database schemas and query results in the form of a graph, table, or in JSON. This is a very useful tool for exploring databases and debugging applications during prototyping phase. This post describes a brief overview of the main features of KùzuExplorer with pointers to KùzuExplorer documentation for details.
Launching KùzuExplorer
KùzuExplorer is a web application that is launched from a deployed Docker image. Assuming you have Docker
installed before proceeding, you can launch KùzuExplorer on an existing DBMS you have or on an empty database.
Details about how to launch KùzuExplorer can be found here.
For example, to start KùzuExplorer on an empty
database, you can simply run the following command on your shell, and then access KùzuExplorer by going to
http://localhost:8000
docker run -p 8000:8000 --rm kuzudb/kuzu-ui:latestKùzuExplorer comes bundled with several pre-existing databases, one of which you can use to get started.
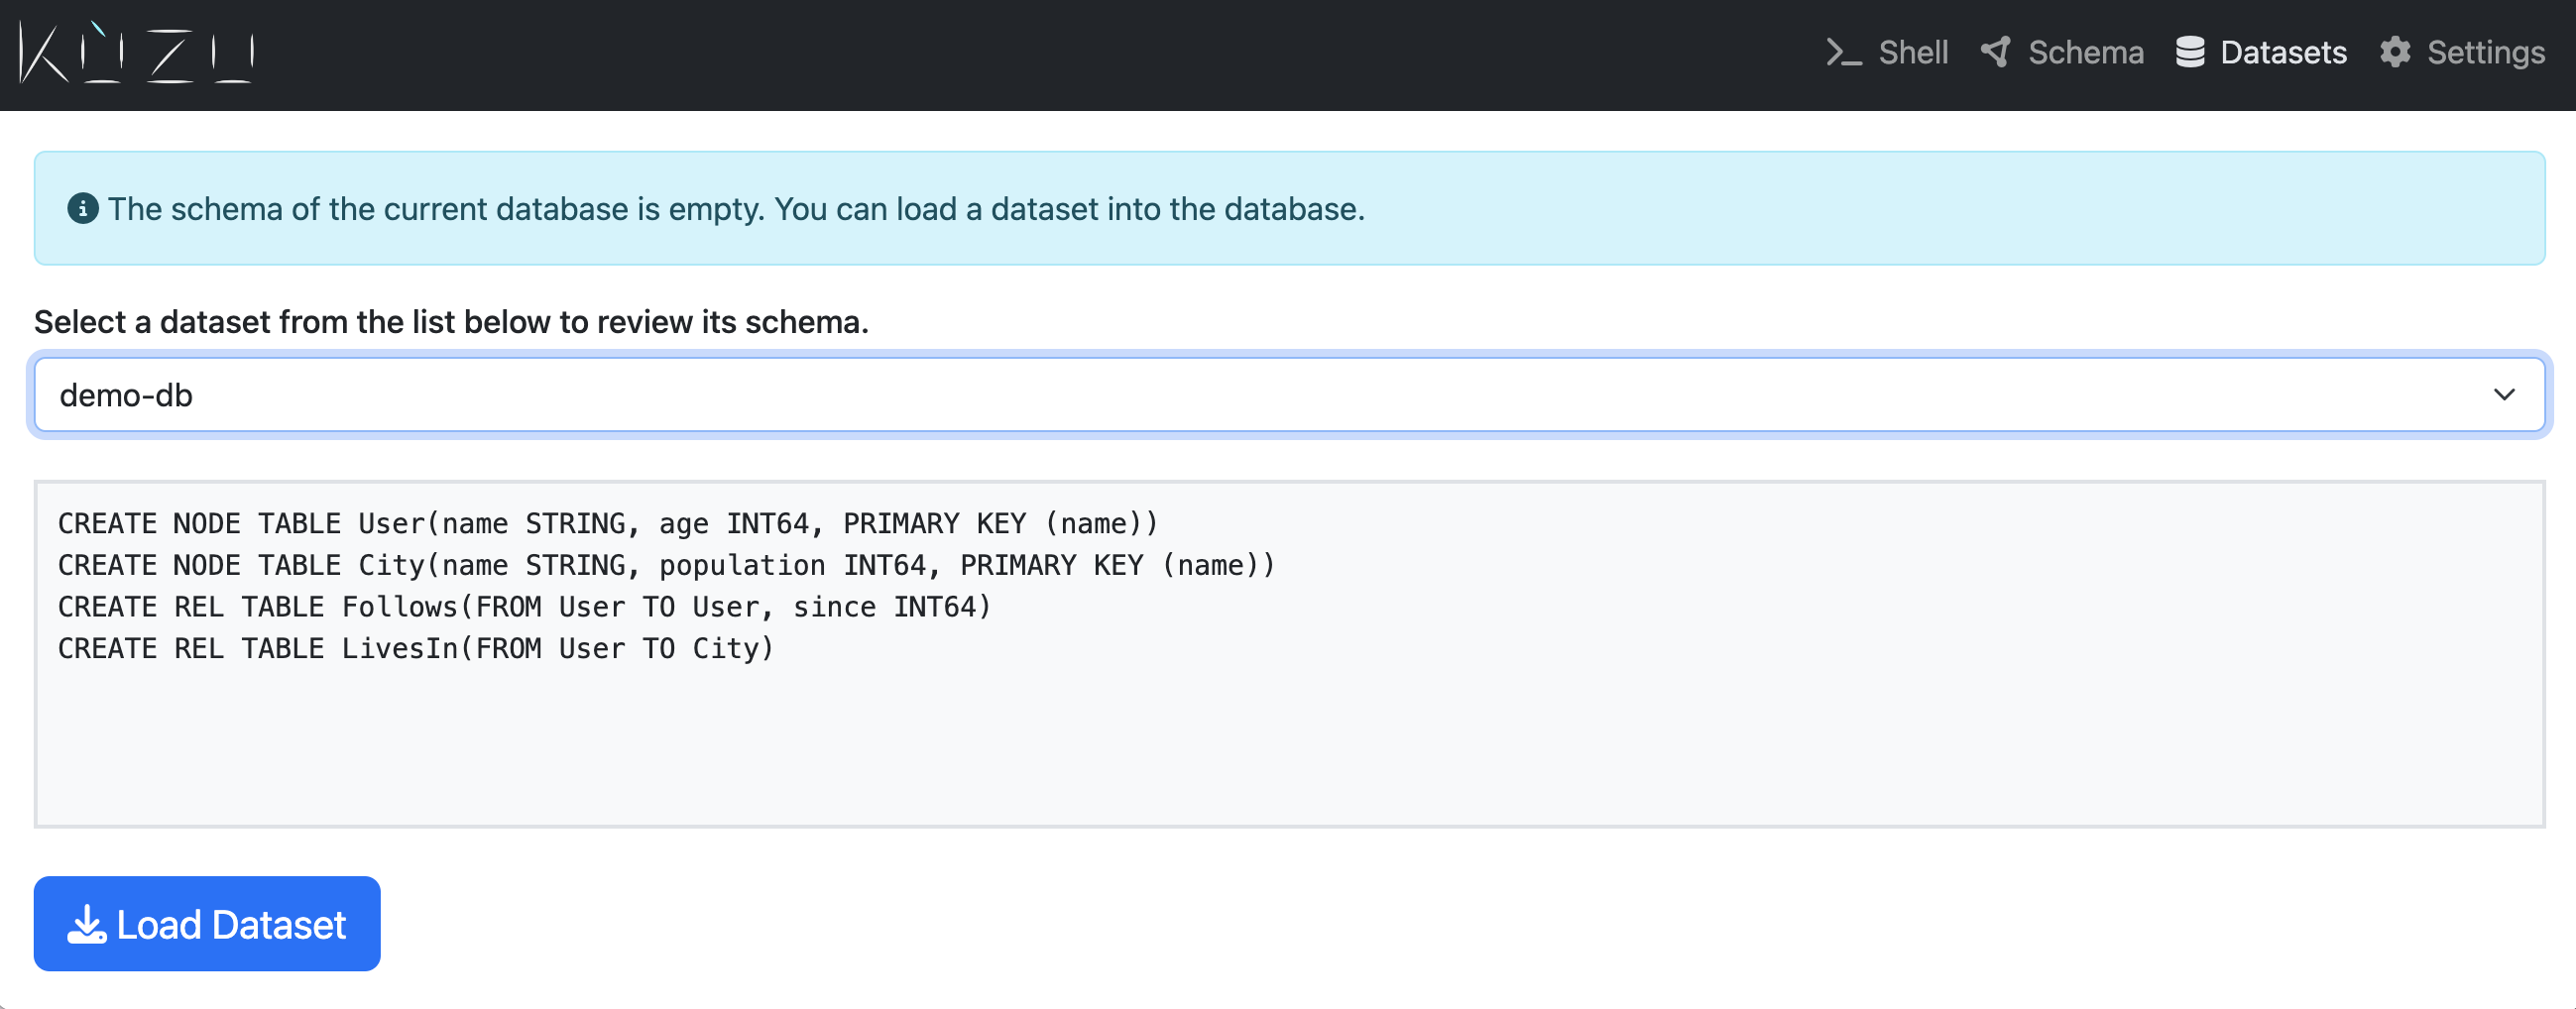
To load one of these databases, click the Datasets tab on the top right corner on your landing page
and then the Load Dataset button as shown in the below figure.

Schema Panel: Schema Exploring and Editing
One of the two main functionalities of KùzuExplorer is to explore and modify the schema of your database.
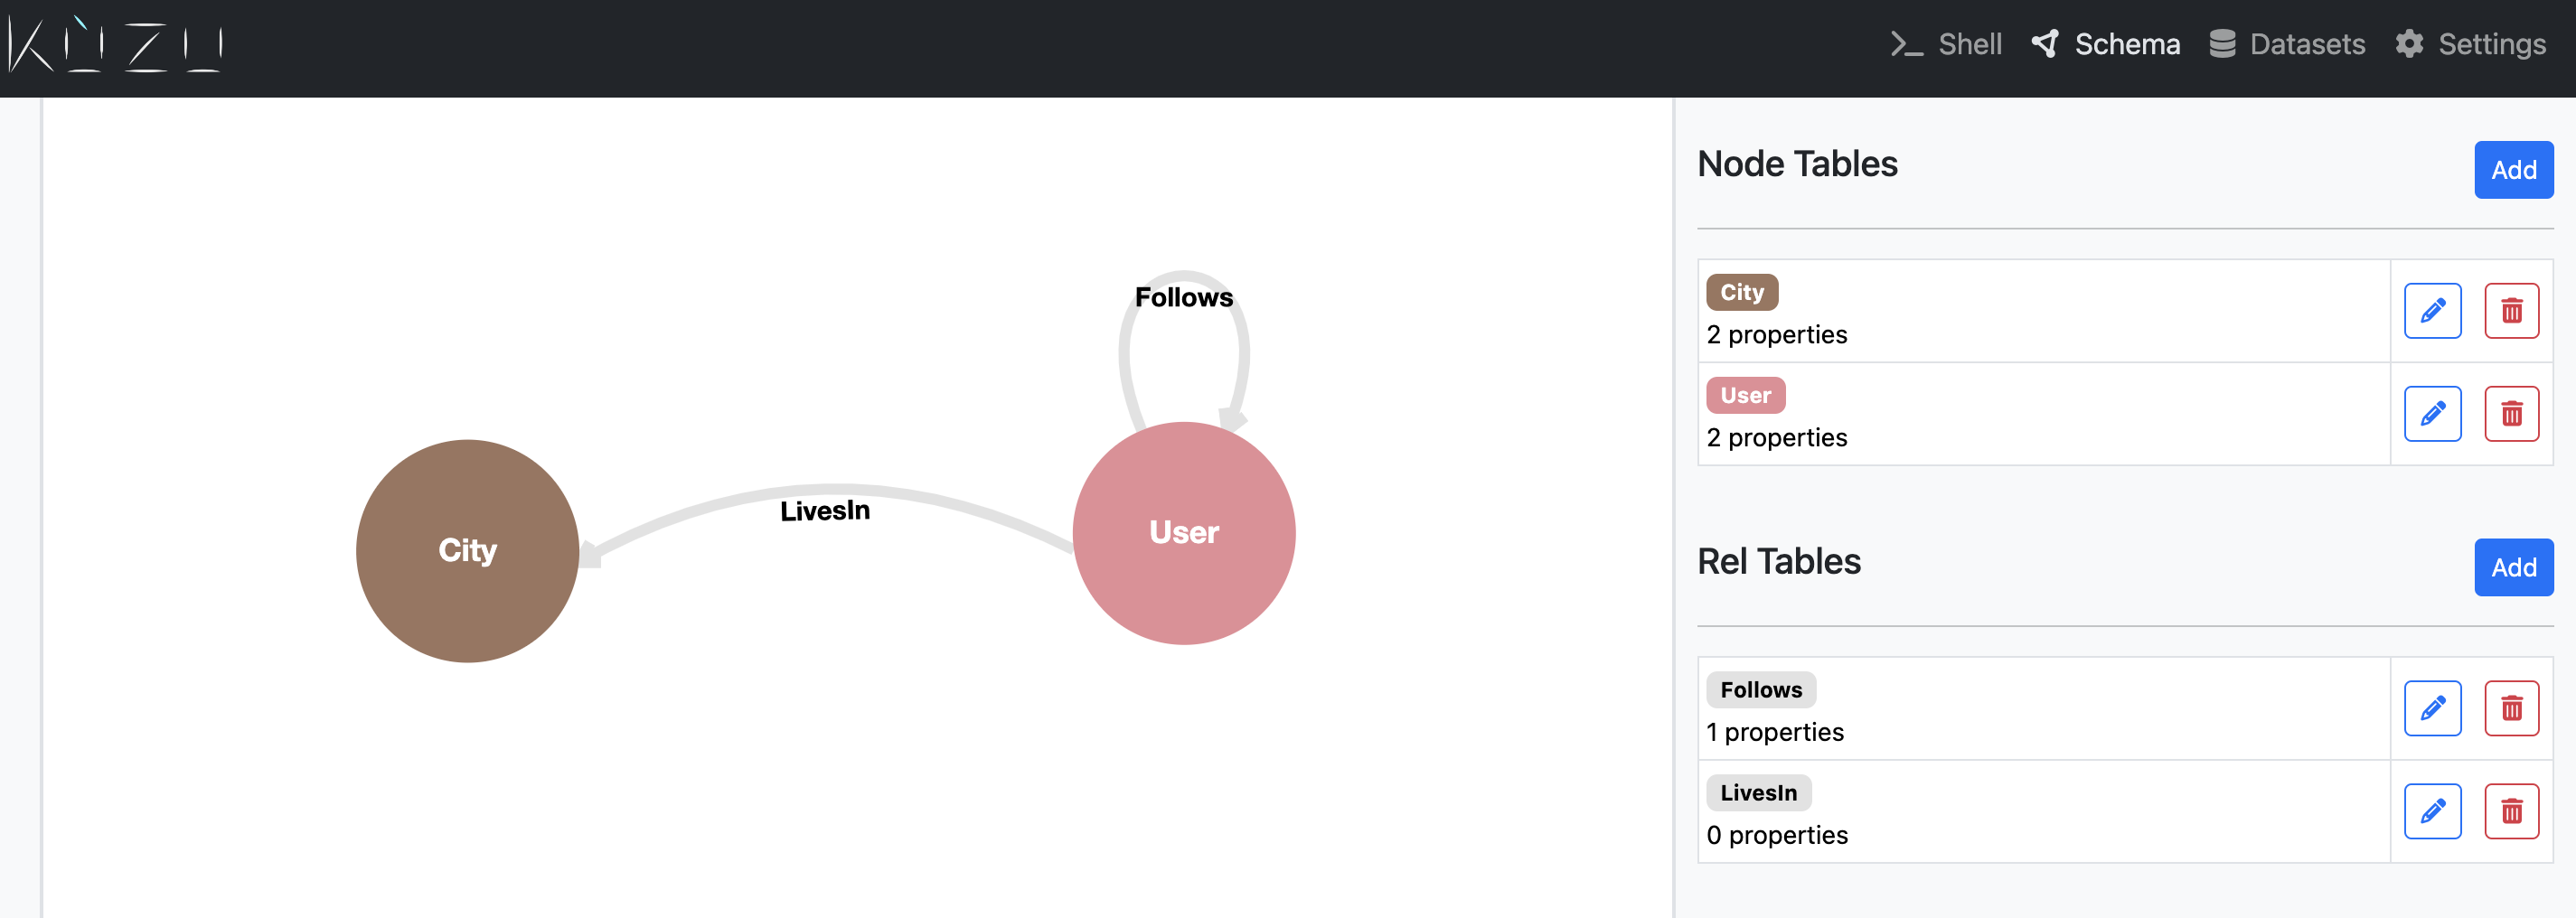
By clicking the Schema tab on the top right corner, you’ll get to a page that shows you the
Node and Relationship tables in your database in a node-link view on the left. Using the right panel,
you can do several things to explore and modify your tables, such as by adding new properties to your
node/rel tables, inserting new node/rel tables, or dropping node/rel tables. These changes can all be done
interactively by clicking buttons, which automatically generate and run the corresponding Cypher queries
(unless you have launched KùzuExplorer in read-only mode).

More details about what can be done in the Schema panel can be found here.
Shell Panel: Query Result Visualization
Using KùzuExplorer, you can also issue Cypher queries similar to Kuzu’s
command line interface, and
visualize the results of these queries.
To issue queries go to the Shell tab on the right corner and you can type a Cypher query.
As you type your query, KùzuExplorer shell will suggest keyword completions, which can
help you write your queries. You can then click the green “play” icon on the left hand
side of the shell panel, which will execute your queries and display the results. The
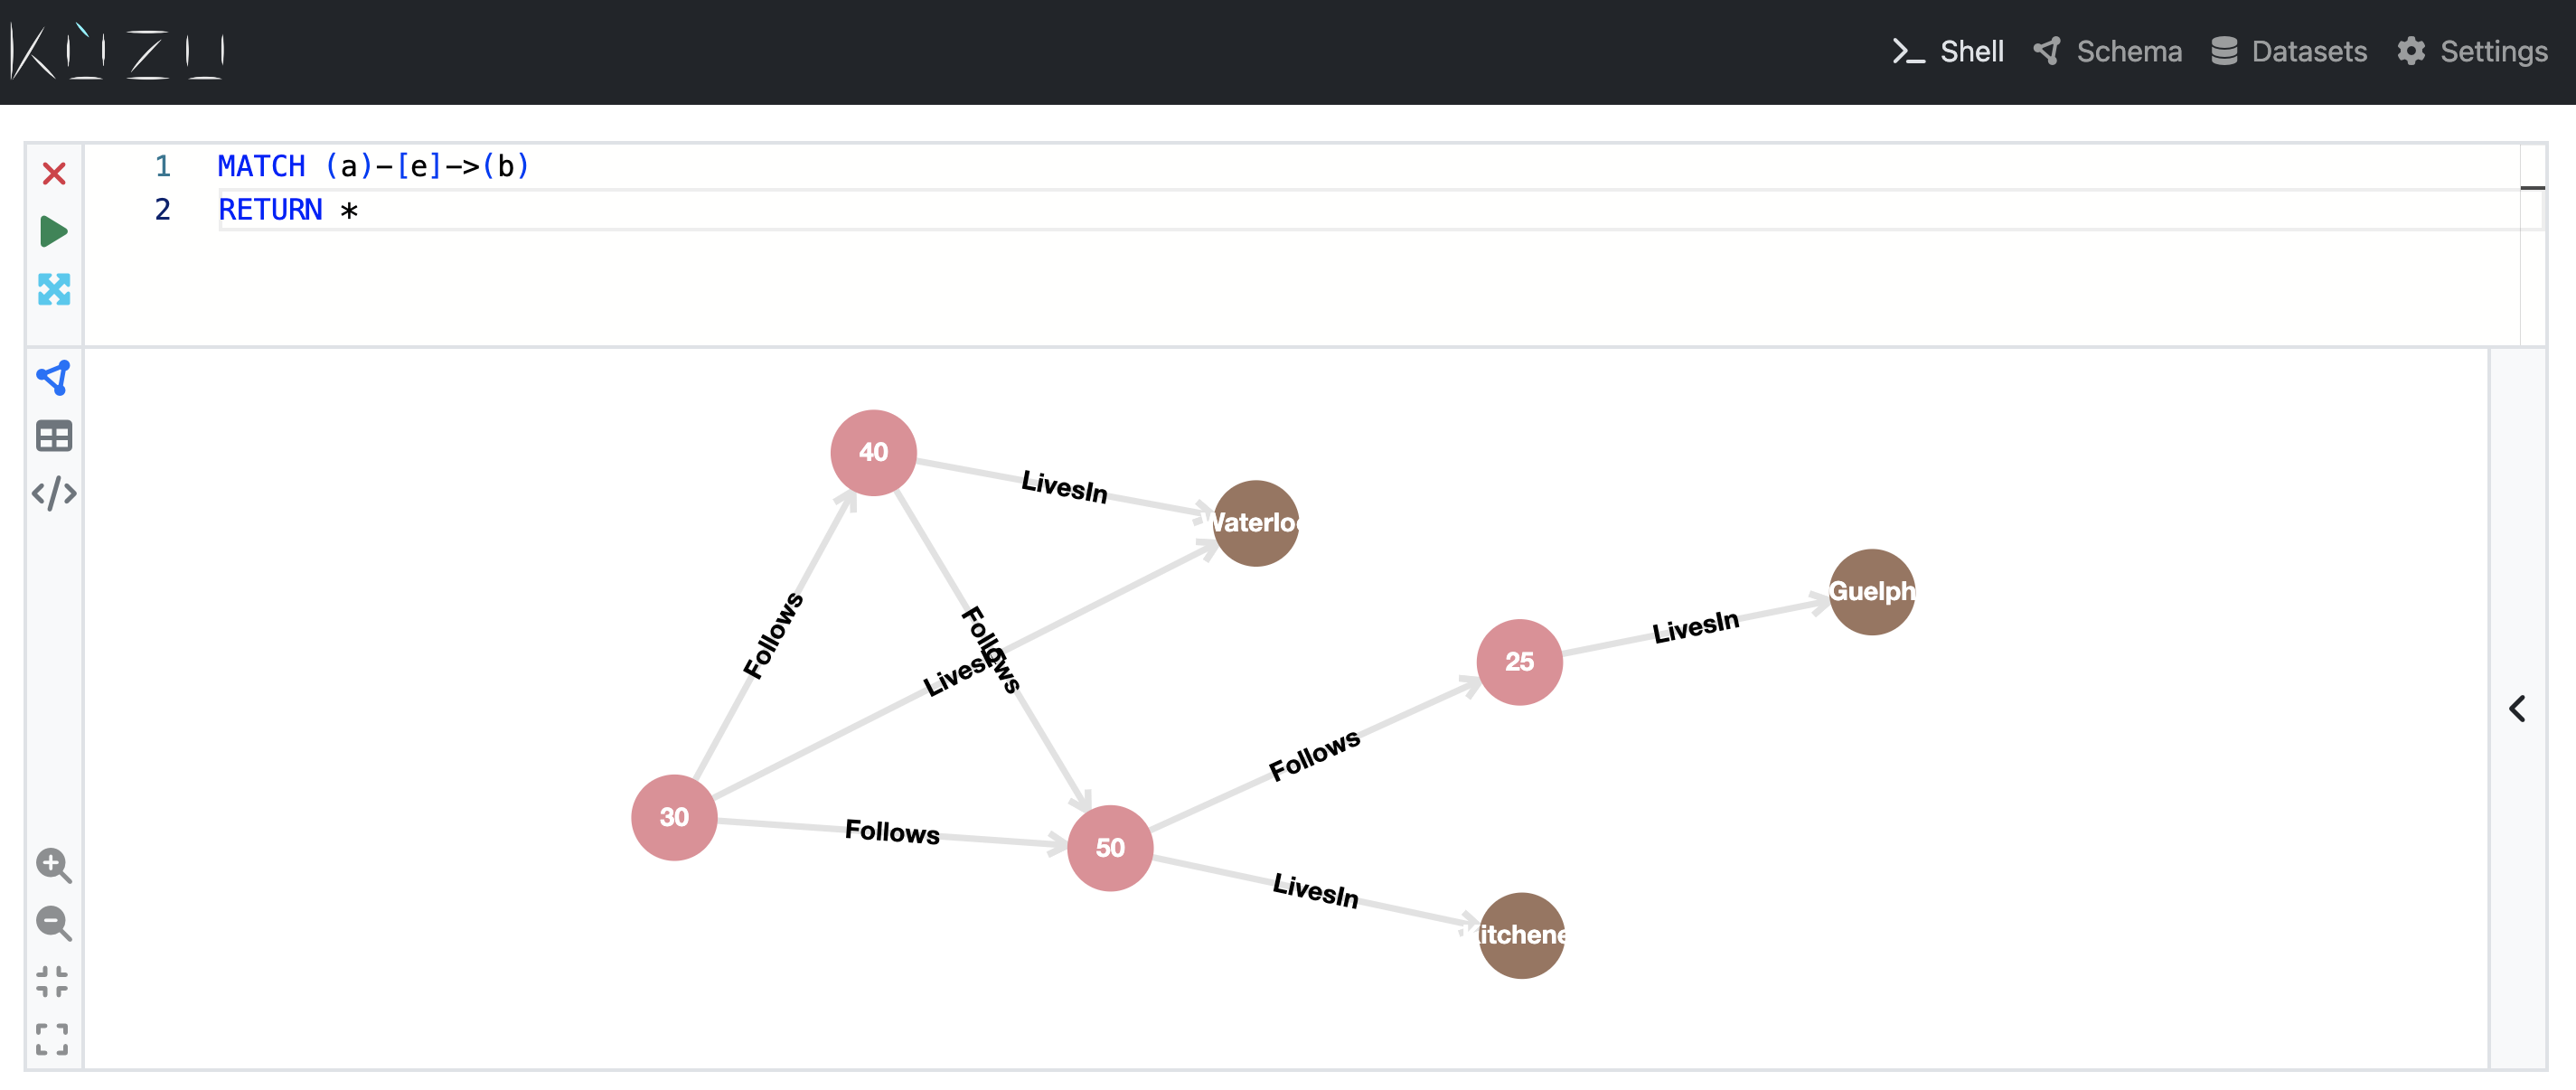
results can be displayed in three different modes: (i) a node-link graph view; (ii) a table; or (iii) as json.
As an example, the below image presents the results of the following query which retrieves all nodes and edges
in the database in a node-link graph view:
MATCH (a)-[e]->(b)
RETURN *
You can inspect individual nodes and edge in the query results by clicking on them. More details about what can be done in the Shell panel can be found here.
Settings Panel: Configuring Visualizations
There is also a Settings tab on the right hand corner, which can be used for several more advanced
setting changes, e.g., changing the colors or sizes of nodes of a certain type (e.g., User nodes) or
the maximum number of nodes to plot on the node-link graph visualizations when visualizing query results.
Details of these can be found here.
Final Words
KùzuExplorer should be quite useful especially when developing your applications for exploration and debugging purposes, e.g., you can interactively debug why your queries do not return the results you expect using KùzuExplorer by exploring the actual nodes and relationships in your database.
This is our first version of KùzuExplorer and we will be improving it over time. We hope you enjoy using KùzuExplorer and help us make it better! Please send us any feature or documentation requests or bug reports by opening an issue in KùzuExplorer’s github repo!


