
From data to insights: Entity-resolved knowledge graphs with Kuzu & Senzing

AI Engineer at Kùzu Inc.

Principal DevRel Engineer at Senzing
Investigative graph analyses involve using a variety of graph queries and network analysis techniques to uncover patterns, relationships, and insights within complex data represented as a graph. They are commonly used in domains like social networks, finance, cybersecurity, and biology to discover useful relationships and structures within the data. However, a common challenge faced by developers of these applications is in creating high quality knowledge graphs for downstream tasks.
Let’s start by defining what we mean by “high quality” in the context of knowledge graphs. When working with data from multiple sources, the same entity may be represented by different names, aliases, or other identifiers in each source, leading to duplicate entities (i.e., nodes) in the graph. This can lead to incorrect or incomplete analysis results, which can be a significant barrier to graph adoption in sensitive domains like the ones mentioned above.
Entity resolution is the process of determining when real-world entities are the same, despite differences in how they are described, or inconsistencies in how the data was entered1. To help solve this problem, Senzing provides a real-time entity resolution SDK that developers can use to resolve entities with relationship-awareness in their graph applications.
Let’s look at an example of using Kuzu with Senzing on a real-world dataset used to uncover financial crimes. If you’re interested in learning how to use a fast and easy-to-use graph database to manage your entity-resolved knowledge graphs, keep reading on!
Data sources
The dataset used in this blog post includes examples of bad-actor tradecraft in the financial domain, such as money laundering, tax evasion, money mules, shell companies, and more.
The data is sourced from two providers:
- OpenSanctions: Provides the “risk” category of sanctions targets and persons of interest who are known to be associated with financial crimes.
- Open Ownership: Provides data about the ultimate beneficial ownership details, linking entities in the data. A “beneficial owner” is a natural person or persons who ultimately owns or controls an interest in a legal entity or arrangement, such as a company, a trust, or a foundation2.
The term “Entity” can refer to a person or company, and the goal of entity resolution is to match like-for-like entities between the two data sources. Because the full dataset from these providers is rather large, we’ll only be using slices of data in this example. Rest assured, the methodology discussed below will scale well even with much larger amounts of data.
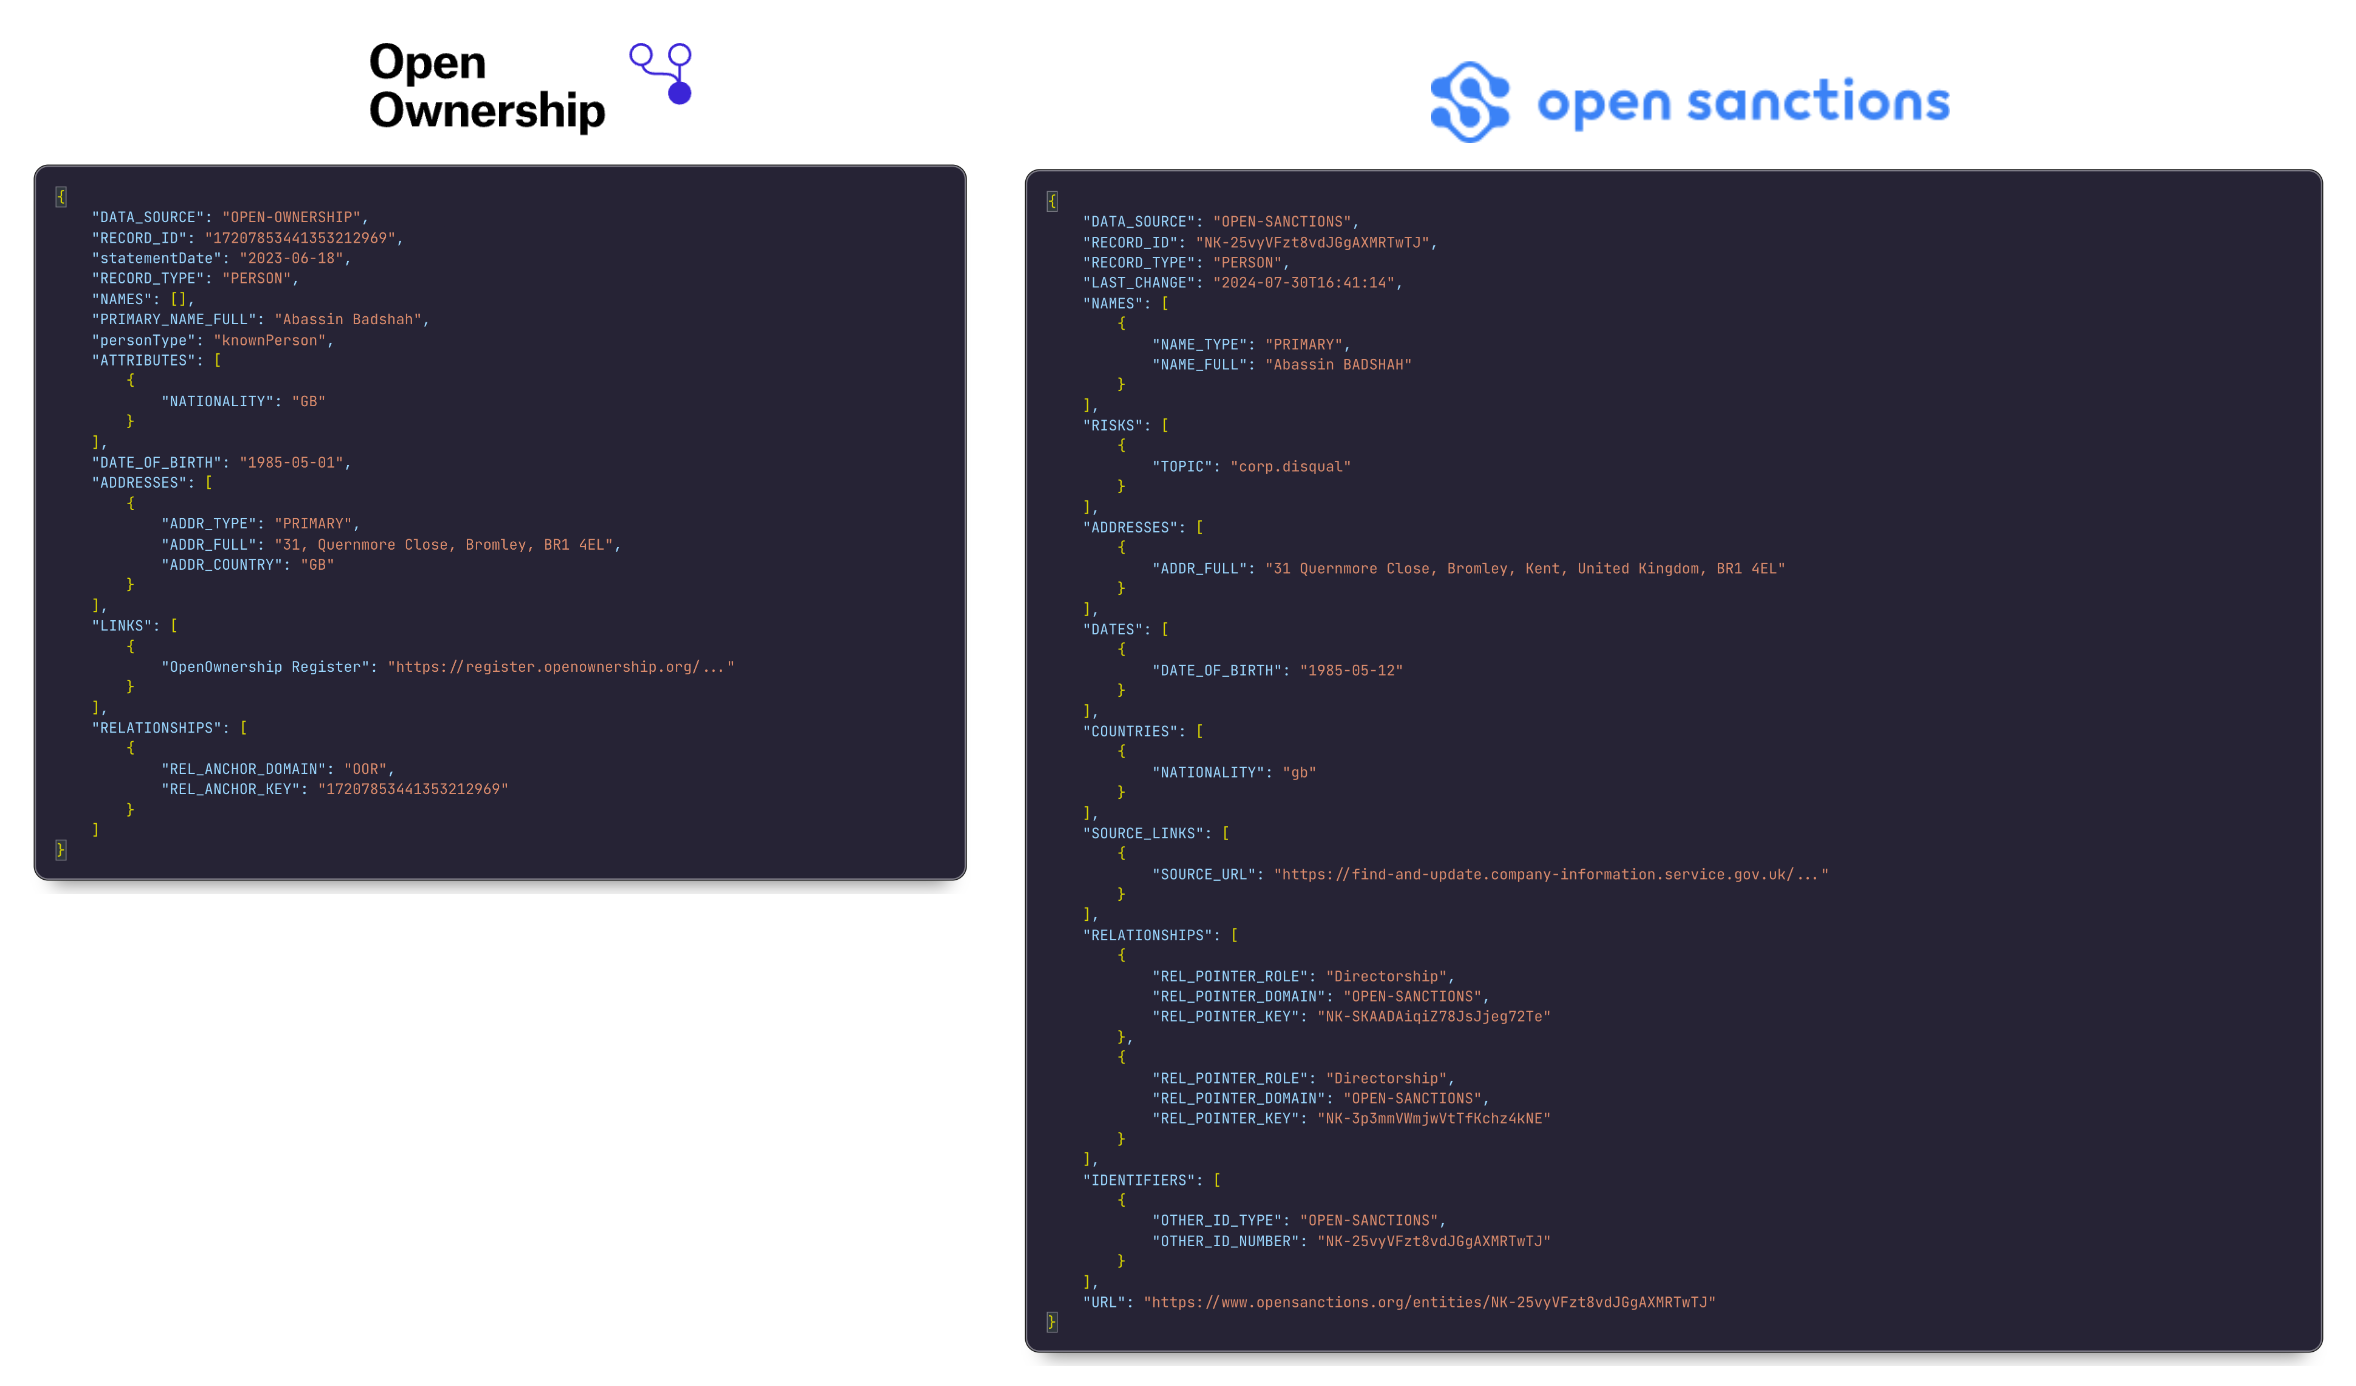
The data from Open Ownership and OpenSanctions is acquired in the form of line-delimited JSON files, and an example record from each file (for the person named Abassin Badshah) is shown below. The data consists of some fields that are common to both sources (such as names, addresses, dates of birth, relationships, etc.), but others that are unique to each source.
Senzing pipeline
This section walks through the sequence of steps in a typical entity resolution workflow using the Senzing Python SDK. The first step is to pass the two input files to the Senzing engine, which will produce a resolved version of the data that maps like-for-like entities between the two sources.
We’ll first launch the Senzing engine in a Docker container, and use its Python SDK to generate the entity-resolved data for the Open Ownership and OpenSanctions datasets. This section walks through the sequence of steps in a typical entity resolution workflow using the Senzing Python SDK.
docker run -it --rm --volume ./data:/tmp/data senzing/demo-senzingLaunching the engine via this command utilizes Senzing’s base layer in Docker, and also includes a set of
Python utilities from the this public repo on GitHub.
These utilities are located within the container, in the /opt/senzing/g2/python directory.
We run the Senzing configuration tool G2ConfigTool.py to create a namespace for the two JSON files (from Open Ownership and OpenSanctions)
that is loaded later:
$ G2ConfigTool.py
>>> addDataSource OPEN-SANCTIONS
>>> addDataSource OPEN-OWNERSHIP
>>> save
save changes? (y/n)
>>> y
>>> exit
The DATA_SOURCE field from the OpenSanctions and Open Ownership data JSON files (as shown below) specify the source of the data, whose
values are the same as those shown above in the config tool commands. This way, the Senzing engine what knows namespace to load the data into.
{
    "DATA_SOURCE": "OPEN-OWNERSHIP",
    ...
}
Next, we load the two input data files from the local machine into the running Docker container:
G2Loader.py -f ./data/open-sanctions.json
G2Loader.py -f ./data/open-ownership.json
The moment the files are loaded, Senzing processes the records on-the-fly, i.e., it can process multiple records in parallel and all temporary files generated during the entity resolution process are stored in the running Docker container’s storage volume. Once finished, we obtain a “resolved” file containing the data, with a unique Senzing entity ID for each entity in the dataset.
The resolved data can be exported to another JSON file that we can access locally, using the G2Export.py tool:
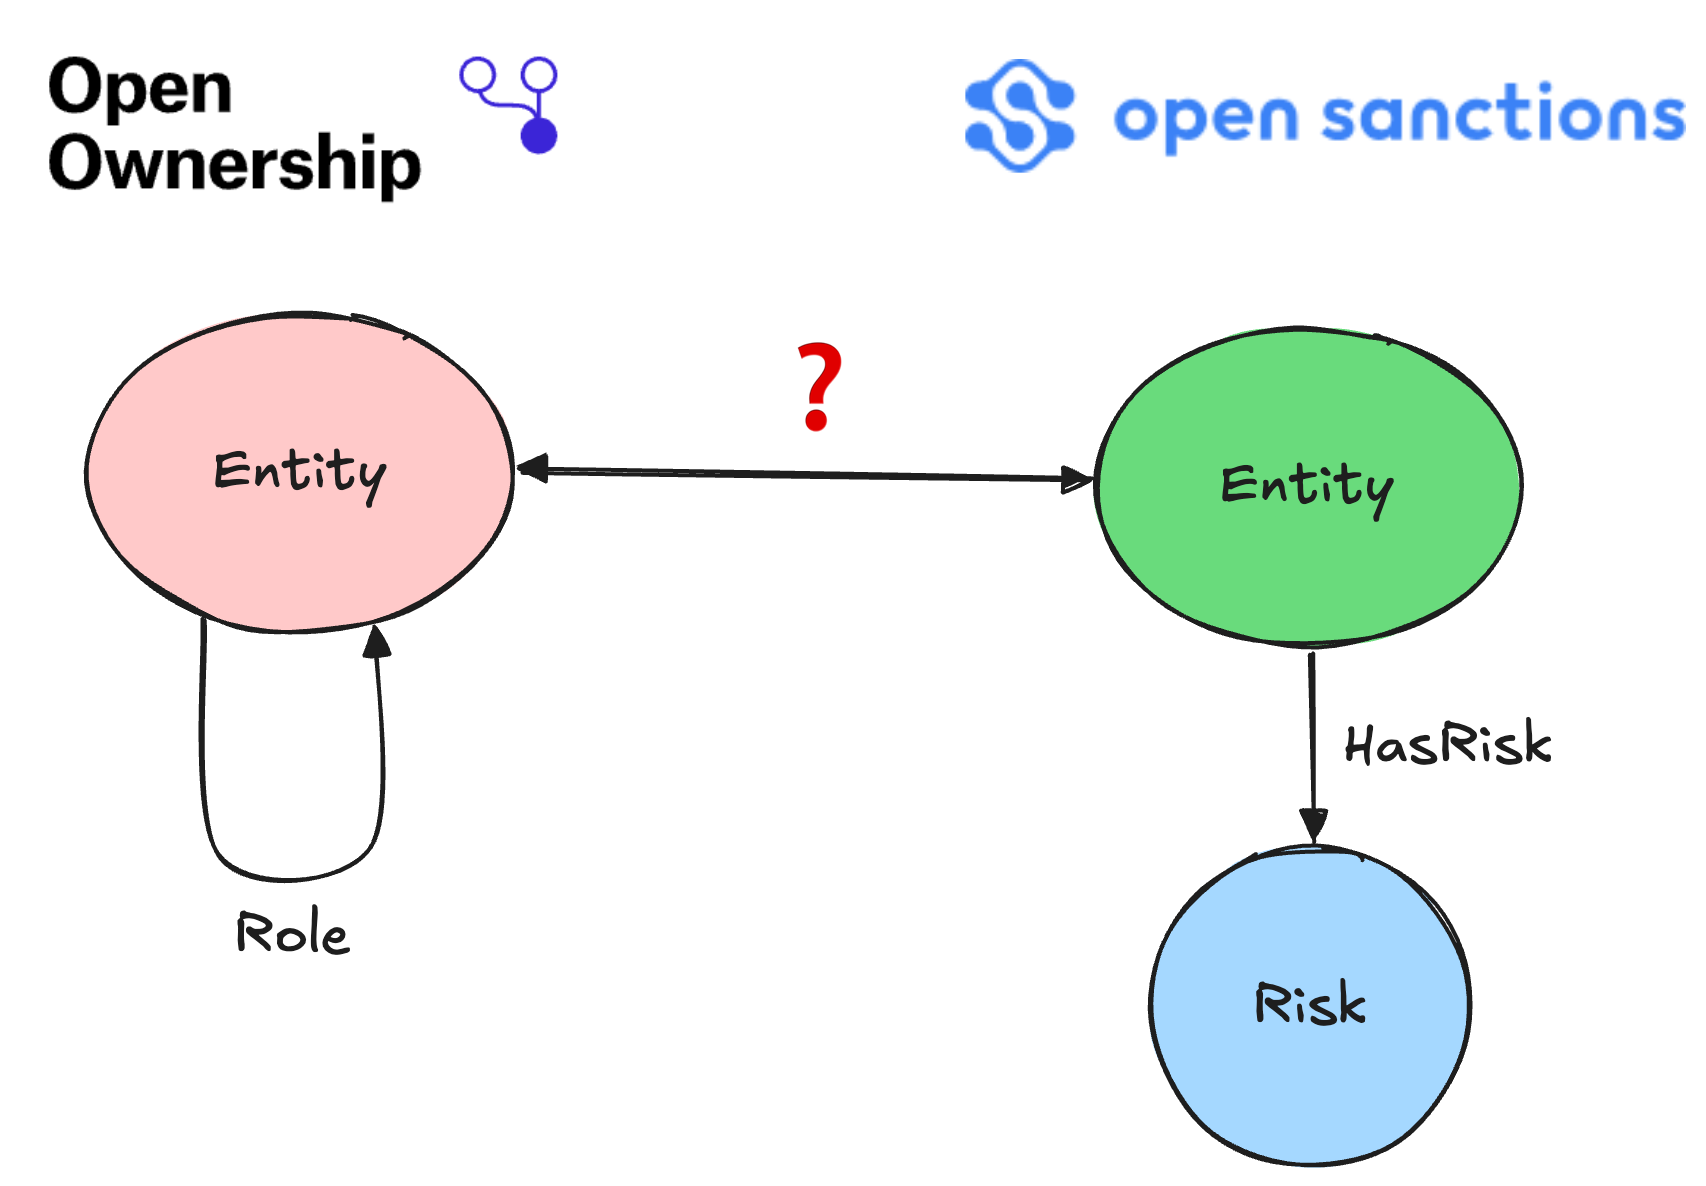
G2Export.py -F JSON -o ./data/export.jsonThis data can now be used to create a high-quality knowledge graph as follows: The Senzing entities form an “overlay” subgraph that connects like-for-like entities between the two sources. The two otherwise disjoint subgraphs (from Open Ownership and OpenSanctions) are brought together to create a single graph with edges between the entities when they represent the same real-world entity. No source data is removed or changed in the process — Senzing simply bridges the two subgraphs, as per the following schema:

This is the entity resolution workflow in a nutshell! We’re now ready to preprocess all the data for ingestion into Kuzu.
Kuzu pipeline
Once we have the source data and the entity-resolved data from Senzing, we are ready to ingest them into Kuzu so that we can query the graph in Cypher.
Data transformations
Because the data from each source can be quite large in practice, it’s important to think about performance and scalability of the data transformation steps for ingestion into Kuzu. Polars is an open-source library for data manipulation, known for being one of the fastest data processing solutions for Python on a single machine. It comes with a rich expressions API that allows for complex queries, being human-readable while also allowing the underlying Polars query engine to optimize the query plan for performance. Let’s look at an example of this in action, using Open Ownership data.
import polars as pl

# Read newline-delimited JSON files
df = pl.read_ndjson("data/open-ownership.json")

# First, explode ATTRIBUTES for all records
df = df.explode("NAMES").explode("ATTRIBUTES")

# Extract nationality from person or organization
# Uses a Polars when-then-otherwise expression
df = df.with_columns(
    pl.when(pl.col("RECORD_TYPE") == "PERSON")
    .then(pl.col("ATTRIBUTES").struct.field("NATIONALITY"))
    .when(pl.col("RECORD_TYPE") == "ORGANIZATION")
    .then(pl.col("REGISTRATION_COUNTRY"))
    .otherwise(None)
    .alias("country")
    )

print(df.filter(pl.col("name") == "Abassin Badshah"))
The above code snippet processes the nested JSON data from the Open Ownership dataset to extract the country of nationality of the entity. Note that instead of using vanilla Python functions, we’re using the when-then-otherwise expression API in Polars to handle the different cases. This is much more efficient than mapping vanilla Python functions over the DataFrame using loops, while also being more readable and concise3.
Similar operations are performed on the remaining fields from the Open Ownership as well as the OpenSanctions data to preprocess the data that will be used to create the individual subgraphs for each source in Kuzu downstream. Here’s the subset of the Open Ownership data that contains information about the entity “Abassin Badshah”:
┌─────────────────┬──────────────────────┬─────────┬─────────────────────────────────┐
│ name            ┆ id                   ┆ country ┆ address                         │
│ ---             ┆ ---                  ┆ ---     ┆ ---                             │
│ str             ┆ str                  ┆ str     ┆ str                             │
╞═════════════════╪══════════════════════╪═════════╪═════════════════════════════════╡
│ Abassin Badshah ┆ 17207853441353212969 ┆ GB      ┆ 31, Quernmore Close, Bromley, … │
│ Abassin Badshah ┆ 6747548100436839873  ┆ GB      ┆ 3, Market Parade, 41 East Stre… │
└─────────────────┴──────────────────────┴─────────┴─────────────────────────────────┘
There are two records for this entity, with different addresses in the UK.
Bulk-ingest data
During data ingestion, Kuzu can natively scan and copy from Polars DataFrames. There are several advantages to copying data directly from DataFrames:
- There’s no need to write out transformed data to external files — under the hood, the Polars DataFrame object is transformed into an Arrow table, and Kuzu scans and transforms Arrow data types into native Kuzu data types. Like Kuzu, Polars/Arrow are also columnar systems, so the overall transport of data is more efficient than reading from disk-based formats like CSV or JSON.
- The same DataFrame object in memory can be subset and used to populate multiple tables in Kuzu, which reduces unnecessary I/O operations.
- The Arrow table is passed to Kuzu in batches, so there’s no need to write loops in Python to handle the batches, minimizing Python-related overhead.
All in all, this is an efficient and scalable way to ingest data into Kuzu! The following code snippet
shows how to bulk-ingest the data into the OpenSanctions and OpenOwnership node tables in Kuzu,
as well as the relationships between them and the Entity nodes obtained from the Senzing entity resolution workflow.
import kuzu

db = kuzu.Database("kuzu_er_db")
conn = kuzu.Connection(db)

# Define the schema (create node tables and relationship tables)
conn.execute("CREATE NODE TABLE IF NOT EXISTS OpenSanctions (id STRING PRIMARY KEY, kind STRING, name STRING, addr STRING, url STRING)")
conn.execute("CREATE NODE TABLE IF NOT EXISTS OpenOwnership (id STRING PRIMARY KEY, kind STRING, name STRING, addr STRING, country STRING)")
conn.execute("CREATE NODE TABLE IF NOT EXISTS Entity (id STRING PRIMARY KEY, descrip STRING)")
conn.execute("CREATE REL TABLE IF NOT EXISTS Role (FROM OpenOwnership TO OpenOwnership, role STRING, date DATE)")
conn.execute("CREATE REL TABLE IF NOT EXISTS Related (FROM Entity TO Entity, why STRING, level INT8)");

# Bulk-ingest the data from their respective Polars DataFrames
conn.execute("COPY OpenSanctions FROM df_os")
conn.execute("COPY OpenOwnership FROM df_oo")
conn.execute("COPY Entity FROM (LOAD FROM df_ent RETURN id, descrip)")

# ... more code to transform the data to gather the relationships into another DataFrame

# Bulk-ingest the relationships between the entities
conn.execute("COPY Role FROM df_oa_relationships")
conn.execute("COPY Role FROM df_os_relationships")

# Create relationship table between Senzing entities and original source nodes
conn.execute(
    """
    CREATE REL TABLE IF NOT EXISTS Matched (
        FROM Entity TO OpenSanctions,
        FROM Entity TO OpenOwnership,
        why STRING,
        level INT8
    )
"""
)
conn.execute("COPY Matched FROM df_sz_os (from='Entity', to='OpenSanctions')");
conn.execute("COPY Matched FROM df_sz_oo (from='Entity', to='OpenOwnership')");
Using this approach, we can bring in large amounts of data via Polars transformations to build the graph in Kuzu. For this sample dataset, we can visualize nodes4 around the vicinity of the entity “Abassin Badshah”:
MATCH (a:Entity)-[b *1..3]-(c)
WHERE a.descrip CONTAINS "Abassin"
RETURN * LIMIT 50
- Yellow nodes represent the entities obtained from the Senzing entity resolution workflow
- Green nodes represent
OpenSanctionsentities - Red nodes represent
OpenOwnershipentities - Blue nodes represent the risks associated with
OpenSanctionsentities
As can be seen, entity resolution works by overlaying the resolved entities on top of the original graph (rather than physically merging entities in the two subgraphs), and does not delete any source data in the process. By writing an undirected Cypher query to traverse paths around the vicinity of entities that contain the string “Abassin”, we can find all the relevant data relevant to the entity “Abassin Badshah”. A number of shell companies are identified as related to Abassin and his spouse, Rehana Badshah, both of whom colluded in a tax evasion scheme5. This example demonstrates the power of bringing together multiple data sources as a graph to help analyze financial crimes.
Network analysis
Writing simple Cypher queries to visually explore the graph is good enough for a local understanding of an entity and what it’s connected to. However, we can do better than that! In this section, we’ll cover an example of running a graph algorithm (betweenness centrality) to identify influential nodes in the network.
Betweenness centrality is a useful algorithm for identifying the key players in fraud rings because it measures how often a node appears on the shortest paths between other nodes. A high betweenness centrality score could indicate a connection to potential money laundering or other suspicious financial activities, which helps domain experts narrow down on important entities as they analyze the data.
Kuzu makes it simple to run graph algorithms on the graph via NetworkX or via a native graph algorithms package6. The code below shows how to easily transform a Kuzu subgraph into a NetworkX graph, run a graph algorithm on it, and then bring the results back into Kuzu.
import polars as pl
import networkx as nx

# Export Kuzu subgraph to NetworkX
# We only ask for Senzing entities, OpenOwnership entities, and OpenSanctions entities
subg = conn.execute(
    """
    MATCH (a:Entity:OpenOwnership:OpenSanctions)-[b]->(c:Entity:OpenOwnership:OpenSanctions)
    RETURN *
    """
)
subg_networkx = subg.get_as_networkx(directed=True)

# Run NetworkX's betweenness centrality algorithm
bc = nx.betweenness_centrality(subg_networkx)

#  Transform the betweenness centrality results into a Polars dataframe
df = pl.DataFrame({"id": k, "betweenness_centrality": v} for k, v in bc.items())
df = (
    df.with_columns(
        pl.col("id").str.replace("Entity_", "")
        .str.replace("OpenOwnership_", "")
        .str.replace("OpenSanctions_", "")
    )
)

# Bring the data back into Kuzu
conn.execute(
    f"""
    LOAD FROM df
    MERGE (s1:Entity {{id: id}})
    SET s1.betweenness_centrality = betweenness_centrality
    MERGE (s2:OpenSanctions {{id: id}})
    SET s2.betweenness_centrality = betweenness_centrality
    MERGE (s3:OpenOwnership {{id: id}})
    SET s3.betweenness_centrality = betweenness_centrality
    """
)
We can now visualize the neighbourhood of the node with the highest betweenness centrality in the graph using the following Cypher query:
MATCH (a:Entity)
RETURN a.id, a.descrip, a.betweenness_centrality
ORDER BY a.betweenness_centrality DESC
LIMIT 1
The node with the highest betweenness centrality is Victor Nyland Poulsen.
┌───────────┬───────────────────────┬──────────────────────────┐
│ a.id      ┆ a.descrip             ┆ a.betweenness_centrality │
│ ---       ┆ ---                   ┆ ---                      │
│ str       ┆ str                   ┆ f32                      │
╞═══════════╪═══════════════════════╪══════════════════════════╡
│ sz_100036 ┆ Victor Nyland Poulsen ┆ 0.002753                 │
└───────────┴───────────────────────┴──────────────────────────┘
With the Senzing entity ID identified via the above query, we can now visualize the neighbourhood of the node by using a recursive path-finding query in Cypher.
// Pass through the bridge node of Victor Nyland Poulsen and find other downstream nodes
MATCH (a)-[b]->(c:Entity)-[d *1..4]->(e)
WHERE c.id = "sz_100036"
RETURN * LIMIT 200;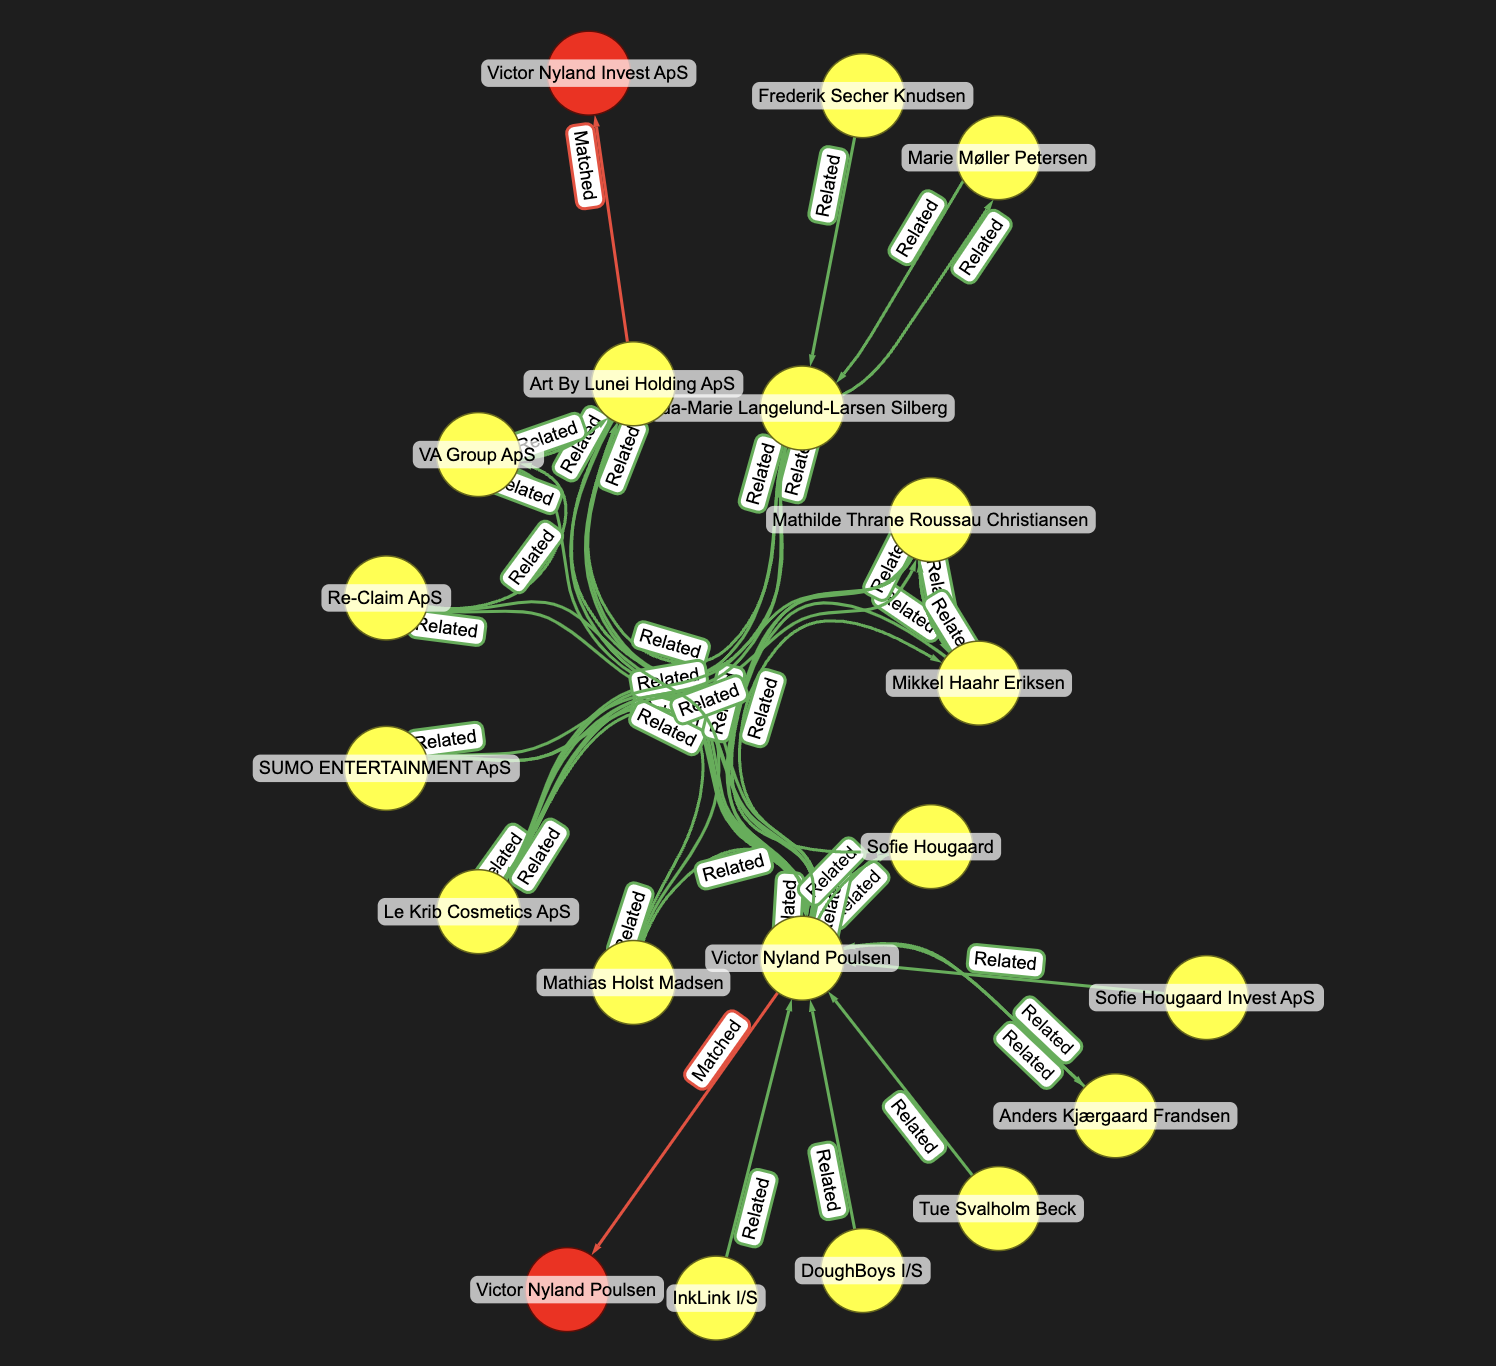
Using the power of graph algorithms, we are able to uncover further useful insights to guide the investigation!
Conclusions
In this post, we covered a sequence of steps to create a high-quality knowledge graph from multiple data sources using Kuzu and Senzing. Entity resolution is a key enabler to the process, as there could be duplicate entities in the data that could hinder the efforts of analysts looking to uncover insights from the connected data. Performing entity resolution using Senzing’s Python SDK and persisting the resolved entities to a Kuzu database allows for efficient and scalable investigative graph analyses downstream.
The following key steps were discussed in this post:
- Use Senzing’s Python SDK to perform entity resolution on the data from two independent data sources: Open Ownership and OpenSanctions
- Use Polars to preprocess the data for ingestion into Kuzu
- Ingest the Senzing entities, OpenSanctions and Open Ownership subgraphs into a single Kuzu database
- Query the graph to find relevant insights about entities of interest (e.g., “Abassin Badshah”)
- Use NetworkX to run graph algorithms on the graph to discover key players in the network (e.g., “Victor Nyland Poulsen”)
Senzing is a real-time, powerful entity resolution engine that can be used in high-impact scenarios like financial crime investigations, providing domain experts with high-quality data sourced from multiple providers. Kuzu is a fast, easy-to-use, open source, embedded graph database and interoperates well with other frameworks and tools to help rapidly transform your existing data into graphs that can be analyzed with Cypher and advanced visualization techniques downstream. Combining these two technologies can enable your organization to build robust, high-quality and scalable knowledge graphs to help uncover insights in all sorts of interesting domains.
We hope you found this hands-on demo useful! Please give Kuzu a star on GitHub, and reach out to us on Discord to learn more about building entity-resolved knowledge graphs.
Code and data
The example shown in this post was presented as a workshop at the 2025 Knowledge Graph Conference in New York City. See this GitHub repository to reproduce the workflow, and feel free to repurpose the code to your own use cases!
Footnotes
-
See Senzing’s blog post: What is entity resolution? ↩
-
For more information on how Open Ownership data can provide information on corporate structures, see this blog post by Stephen Abbott Pugh, former CTO of Open Ownership and the product owner for the Beneficial Ownership Data Standard (BODS). Stephen now leads a consultancy called Understand Beneficial Ownership and is well known for thought leadership and technical guidance on frontier issues relating to beneficial ownership transparency around the world. ↩
-
Polars’
when-then-otherwiseexpressions are similar toif-elif-elseblocks in vanilla Python:when -> if,then -> elif,otherwise -> else. In Polars, expressions are executed at the Rust level in a vectorized manner (rather than row-by-row when using vanilla Python functions withmap_rows), which is why Polars expressions are much faster than Python functions, and recommended for processing larger datasets. See their docs for more examples onwhen-then-otherwiseexpressions. ↩ -
The graph visualizations in this post are created using yFiles Graphs for Jupyter, a free graphing diagram extension for Jupyter notebooks and interactive Python environments. yFiles can connect directly to your local Kuzu database and visualize the graph on the fly, with a variety of custom layout algorithms and styling options, which is very useful for exploratory analysis. ↩
-
Abassin Badshah is infamous for his 2021 conviction for tax fraud while operating a Papa John’s pizza restaurant in London. Badshah under-declared income, evading £669,000 in Income Tax, National Insurance, and Corporation Tax. He was sentenced to four years in prison following an investigation by HM Revenue and Customs (HMRC), which highlighted his suppression of sales figures. The data for OpenSanctions marked Badshah as a “sanctions risk” and his name is one of several other examples of financial misconduct that can be revealed by analyzing the connected information in these datasets. ↩
-
Kuzu provides a native graph algorithms package (available as an extension), which contains several popular graph algorithms, with more being added as of writing this blog post. For algorithms that are not yet available natively in Kuzu, NetworkX is a good alternative as it contains an extensive suite of graph algorithms. Converting between a Kuzu subgraph and a NetworkX graph is also straightforward. ↩